
Last updated: July 16, 2026
Key Takeaways for Fanvue Creators and Agencies
- Fanvue’s growth to 17M monthly users and $100M ARR creates a capacity gap where fan demand outpaces most creators’ ability to deliver varied content.
- Creator inactivity drives 42% of subscriber cancellations, and content variety plus high-quality DMs outperform simple posting more often for improving retention.
- Agencies running multiple Fanvue accounts face compounded risk as single-format catalogs cause novelty exhaustion within 2–3 weeks, which crushes month-two retention before systematic testing can begin.
- Fanvue’s native analytics tools, including AI Insights, tracking links, PPV conversion rates, and cohort reporting, give creators the data needed to build evidence-based content diversification plans.
- Sozee connects Fanvue analytics to execution by automating diversified content scheduling and production; sign up for Sozee today to turn your insights into a complete content calendar.
Fanvue Native Analytics: Terms You Need to Use in Practice
Fanvue’s analytics suite expanded significantly after its $22 million Series A in January 2026. Creators and agencies must understand the native terminology before building any advanced tracking system.
The AI Insights dashboard surfaces high-performing content types and optimal posting times. It also includes an AI coaching layer that analyzes posting patterns and subscriber behavior to suggest specific changes. Ninety-three percent of creators on the platform use at least one native AI tool.
Tracking links are unique URLs assigned per traffic source. They allow creators to see which external channels, such as Reddit, Instagram, TikTok, and X, drive subscribers and their downstream lifetime value. Tracking-link attribution replaces intuition-based growth decisions with evidence-based channel allocation once you manage more than two or three accounts.
PPV conversion rate measures the percentage of active subscribers who unlock a pay-per-view message within a defined window. PPV conversion rates vary by audience and offer, yet they can be substantial when the offer matches clear intent.
Retention metrics include the platform’s native retention graph, which shows when subscribers tend to cancel. This timing insight lets creators plan content interventions around high-churn windows. Cohort reporting groups subscribers by join month so operators can track month-one, month-two, and month-six retention by acquisition source and content cluster instead of only aggregate figures.
Fanvue supports six concurrent monetization channels, including recurring subscriptions, paywalled posts, pay-per-view messages, tips, bundled packages, and standalone checkout links. Each channel can be tracked separately for revenue-focused KPI analysis.
Industry Shifts That Make Advanced Tracking Non‑Optional
Platform growth alone does not explain why advanced analytics now feel mandatory. Fan behavior has changed in ways that make single-metric tracking unreliable.
Deloitte’s 2026 Digital Media Trends report, based on a survey of 3,575 US consumers, shows that fans engage with favorite creators across multiple platforms, with higher rates among Gen Z and millennial fans. This multi-platform behavior means a creator’s Fanvue performance data reflects only part of the fan relationship, so external-traffic attribution becomes essential for understanding real acquisition economics. Deeper engagement, measured by breadth of content, interactions, and in-app purchasing, also correlates with lower churn and higher spending.
Subscribers who engage with multiple content categories retain longer than those focused on a single topic. Cross-topic breadth predicts long-term retention more accurately than content volume. This pattern affects agencies directly. A creator posting daily in one format faces more risk than one posting less often across several categories.
Independent creators face a testing requirement. Agencies managing rosters face an operational requirement. Agencies need a unified CRM with automatic fan classification, split-inbox distribution, and tracking-link attribution to manage subscriber behavior across multiple Fanvue accounts once they pass the two to three account threshold.
Play 1: Build a Content-Category Testing Matrix
A content-category testing matrix maps content types against engagement and monetization outcomes in a repeatable structure. The five steps below turn Fanvue’s AI Insights data into a system you can test and refine.
- Define content categories. Establish at least four distinct categories, such as feed photo sets, short-form video clips, voice notes, and PPV exclusive sets. Each category must differ enough that performance changes come from format, not topic.
- Assign KPIs per category. Map each category to the metrics it should move based on its role in the subscriber lifecycle. Feed posts support subscriber retention and renewal rate because they deliver the baseline value. PPV sets align with conversion rate and revenue per subscriber because they represent direct monetization moments. Voice notes align with first-72-hour engagement and month-two retention because they build intimacy that extends interest beyond visual novelty.
- Run controlled two-week test cycles. Publish each category at a consistent cadence for two weeks. Compare the most recent seven days of data against the prior seven days, broken down by content type, topic, and posting time. Weekly comparisons smooth out daily volatility.
- Score each category. Apply a simplified version of the Digital Applied 2026 content scoring model. Weight engagement depth, such as scroll, watch time, and saves, at 40%. Weight conversion assists, such as PPV unlocks and tip triggers, at 35%. Weight revenue influence, such as ARPU lift and LTV change, at 25%.
- Reallocate production toward top-scoring categories. Reduce or retire the lowest-scoring category each cycle. Quarterly content audits using traffic, engagement, conversion, and revenue data identify underperformers for consolidation and top performers for amplification. The table below shows how four common content categories connect to specific KPIs, benchmarks, and review cadences, using benchmarks drawn from top-performing Fanvue creators.
| Content Category | Primary KPI | Target Benchmark | Review Cadence |
|---|---|---|---|
| Feed photo sets | 30-day retention rate | 65%+ for top performers | Weekly |
| PPV exclusive sets | PPV conversion rate | 18–24% within 14 days | Weekly |
| Voice notes | Month-two retention lift | 8–20 pp above baseline | Bi-weekly |
| Bundled PPV packages | Total PPV revenue lift | 12–18% above unbundled | Monthly |
Play 2: Set Up External-Traffic Attribution with Tracking Links
External traffic attribution on Fanvue starts with a structured link architecture that you apply consistently across every promotional channel. The workflow below creates a reliable first-party attribution stack.
- Create unique tracking links per source. Generate a distinct Fanvue tracking link for each external platform, such as one for Reddit, one for Instagram, one for TikTok, and one for X. Standardize UTM naming using lowercase only, with utm_source as the platform, utm_medium as creator, utm_campaign as the campaign name, and utm_content as the creator handle or post identifier.
- Apply a 14-day measurement window. Treat Day 0 as post-live, Days 1–7 as the primary window, Days 8–14 as the secondary long-tail window, and Day 15+ as roll-up totals compared against a baseline from a similar prior period.
- Choose an attribution model appropriate to the funnel stage. First-touch attribution assigns full credit to the channel that drove the initial Fanvue visit and works best for awareness planning. Last-touch attribution assigns full credit to the final click before subscription and works best for conversion optimization. Run first-touch and last-touch models at the same time, then use a linear or position-based model for overall program reporting. This structure sets up the LTV analysis in the next step.
- Track LTV by source, not just conversion volume. Reddit-sourced subscribers often produce much higher ARPU than TikTok-sourced subscribers, so a channel with fewer conversions can still win on lifetime revenue. Attribution must extend to 30-, 60-, and 90-day cohort LTV per source to capture these differences.
Play 3: Run a Weekly KPI Review for Retention and Revenue
A weekly KPI review replaces reactive posting with a steady operating rhythm. Subscription businesses that review retention weekly usually outperform those that review monthly when they work to reduce churn.
The recommended dashboard tracks five metrics that together show subscriber health and revenue efficiency on a fixed weekly schedule. These metrics form a diagnostic chain. Retention shows whether content holds attention. PPV conversion shows whether engaged subscribers pay. ARPU and cohort LTV show how those behaviors translate into revenue over time, while month-two retention highlights long-term potential.
- Subscriber retention rate targets 60% or higher monthly. Median monthly subscription churn on Fanvue sits at 35–40%, so anything above 60% monthly retention falls into a top-performer range.
- PPV conversion rate targets 20–30% per offer. Monitor this metric in the subscriber pipeline dashboard and flag stages that fall below target. The 18–24% benchmark in the testing matrix applies to a 14-day window, while the 20–30% range here reflects stretch goals for mature funnels.
- Average revenue per subscriber (ARPU) is reviewed weekly. A subscriber who stays six months at $14.99 per month plus $25 average monthly PPV generates $110–$145 in lifetime revenue, compared with $52–$65 at 40% month-two retention.
- Cohort LTV by acquisition source is reviewed monthly. Operators should group subscribers by join month and track cohort value at months one, two, three, and six instead of relying only on first-month revenue.
- Month-two retention rate acts as the most predictive metric for long-term revenue. Month-two active retention varies widely across Fanvue operators, and top performers maintain a clear lead.
Two common pitfalls weaken this framework. The first is single-format reliance. As noted earlier, format diversity outperforms posting frequency for retention, so weekly reviews must track engagement by content category, not just total post count. The second pitfall is ignoring seasonal patterns. Weekly results should be compared with the equivalent week in the prior month, not only the prior week, to separate trend from noise.
How Sozee Turns Fanvue Data into Diversified Output
Fanvue’s AI Insights dashboard reveals what works. The remaining gap is turning those signals into diversified, scheduled content without adding staff. Sozee acts as the execution layer that closes this gap.
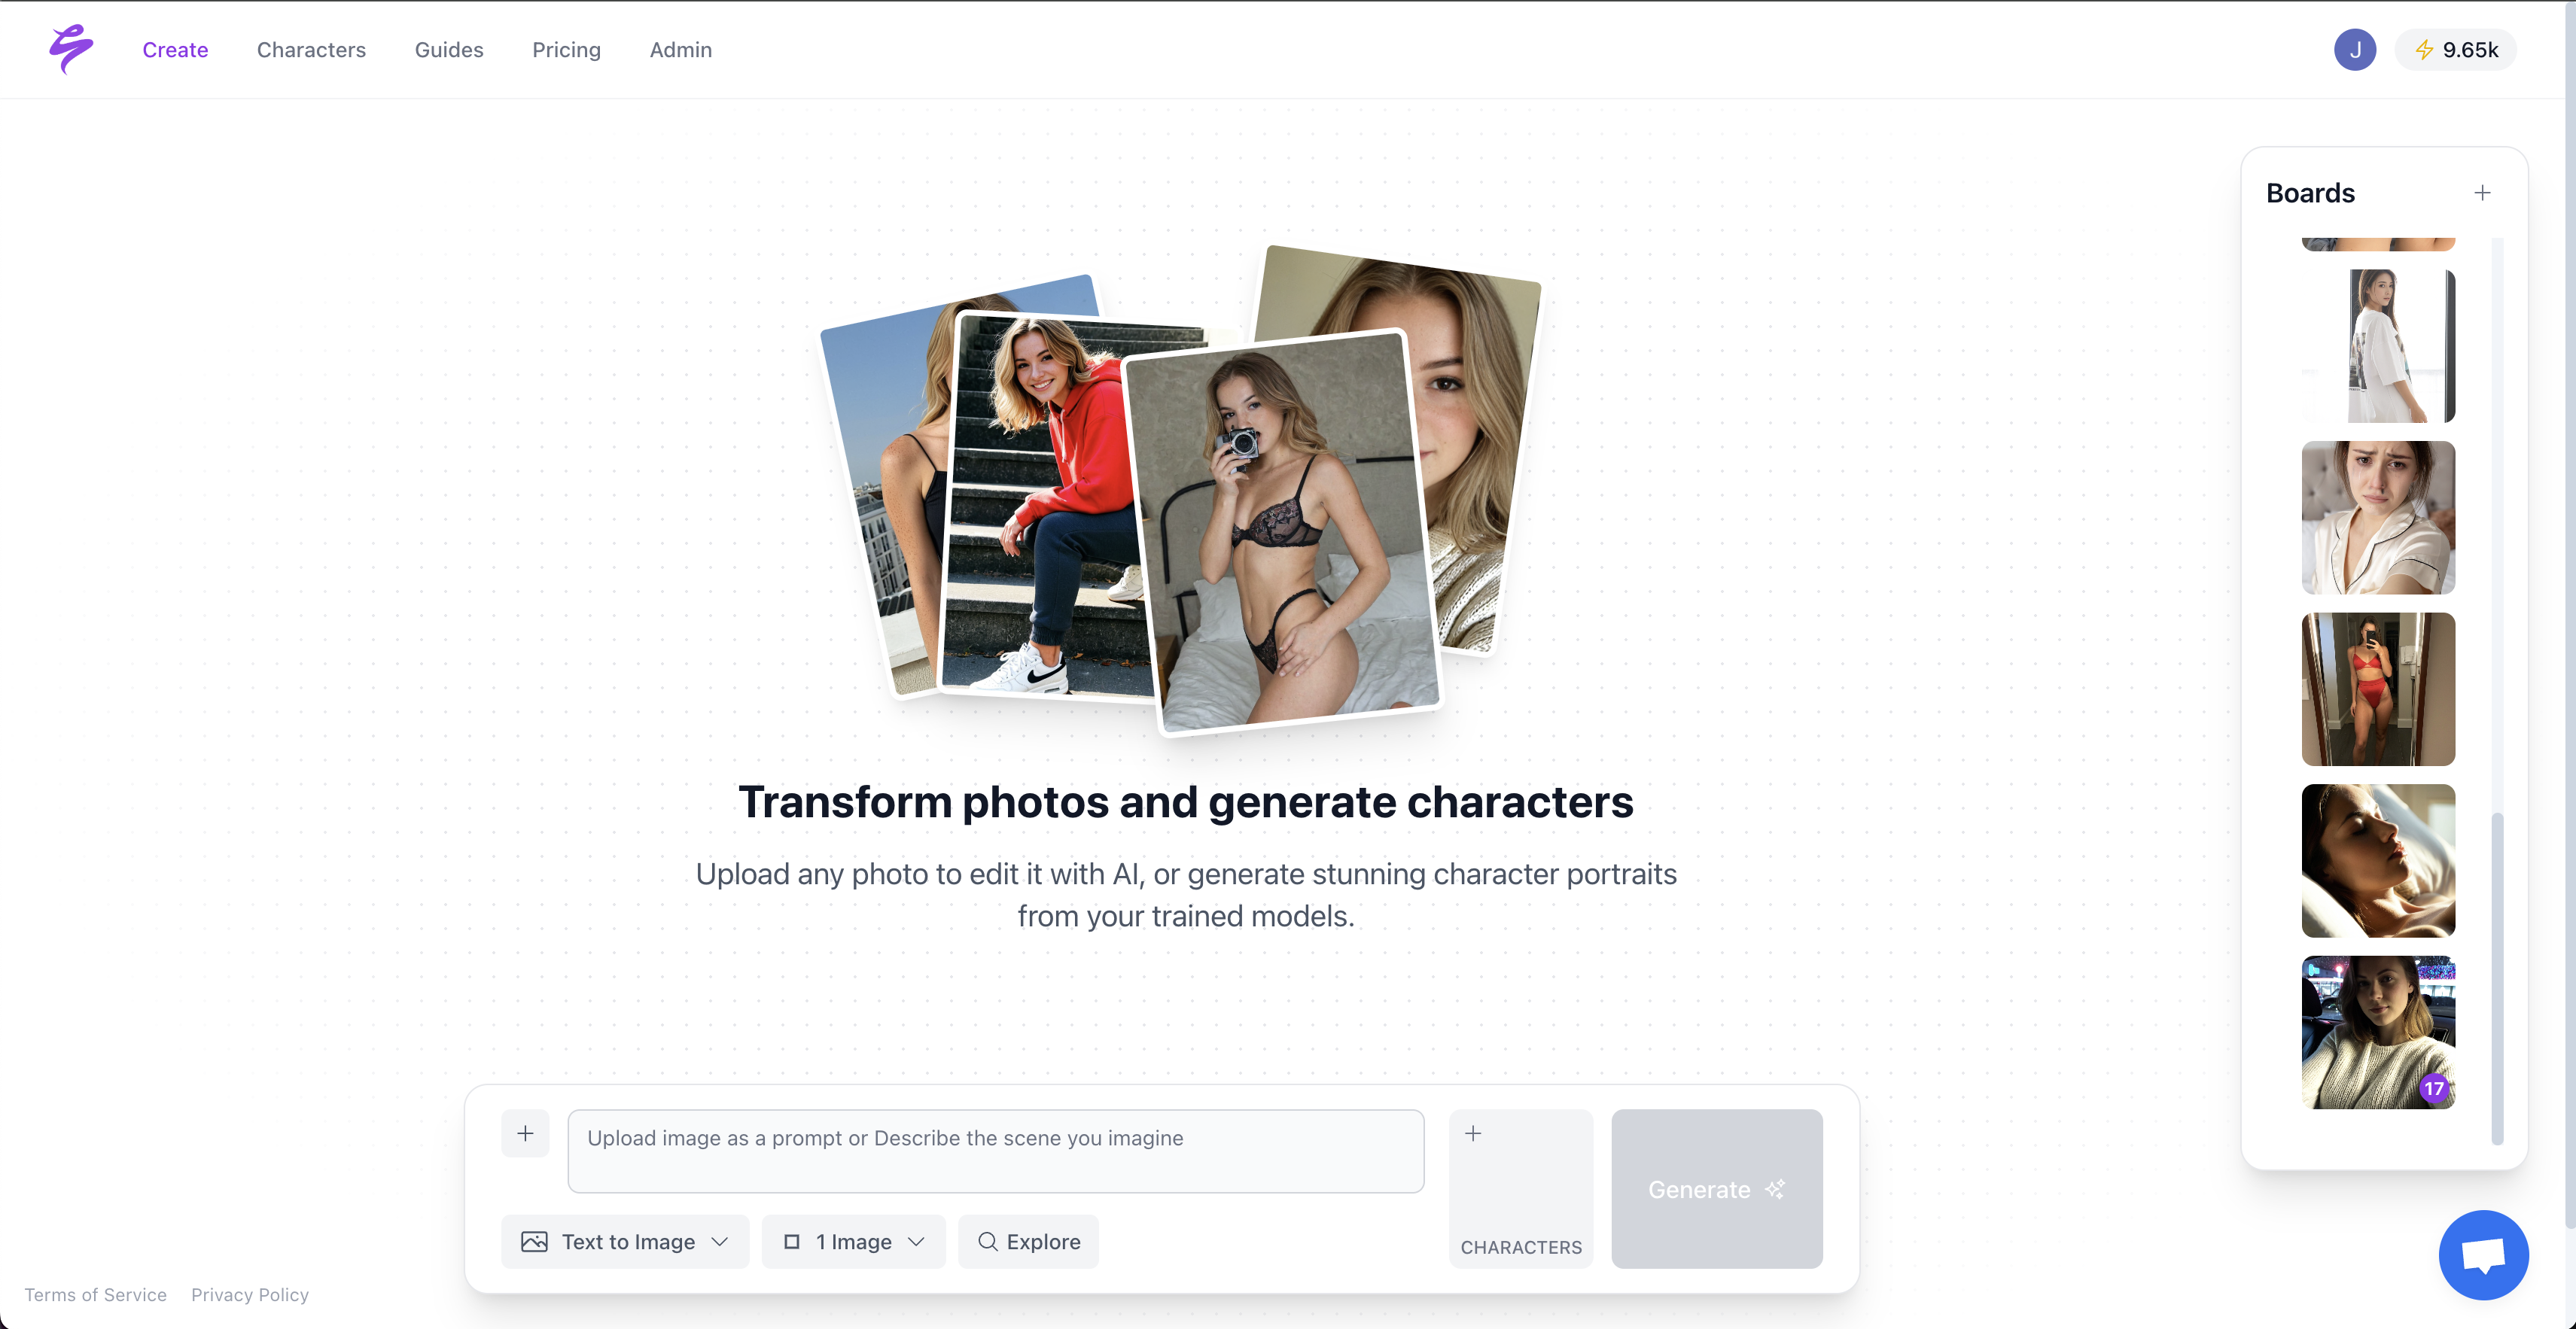
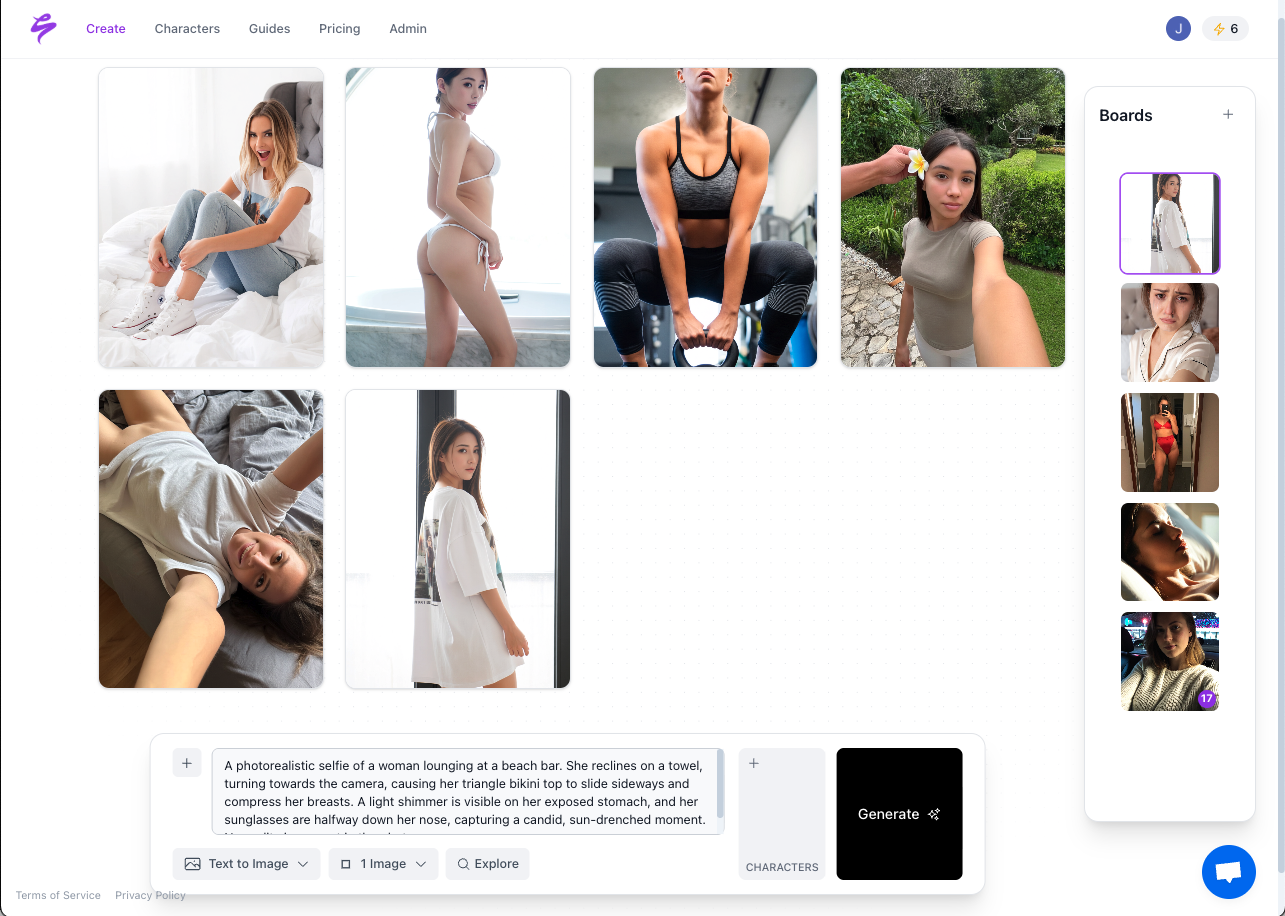
The workflow runs through four connected stages. First, Sozee’s Scheduler connects directly to Fanvue per character, not per account, so agencies can manage diversified posting schedules for an entire roster from one workspace. Second, performance data from Fanvue analytics, including retention curves, PPV conversion rates, and engagement by content type, guides which content categories Sozee emphasizes in the next production cycle. Third, Sozee’s Photo Shoot feature generates a coherent, locked-likeness set of up to ten images from a single frame, which creates a full SFW-to-NSFW content arc in one session. Fourth, the Vault organizes every generated asset by character and content category, then feeds those assets back into the Scheduler so Fanvue analytics can still attribute performance by content type.
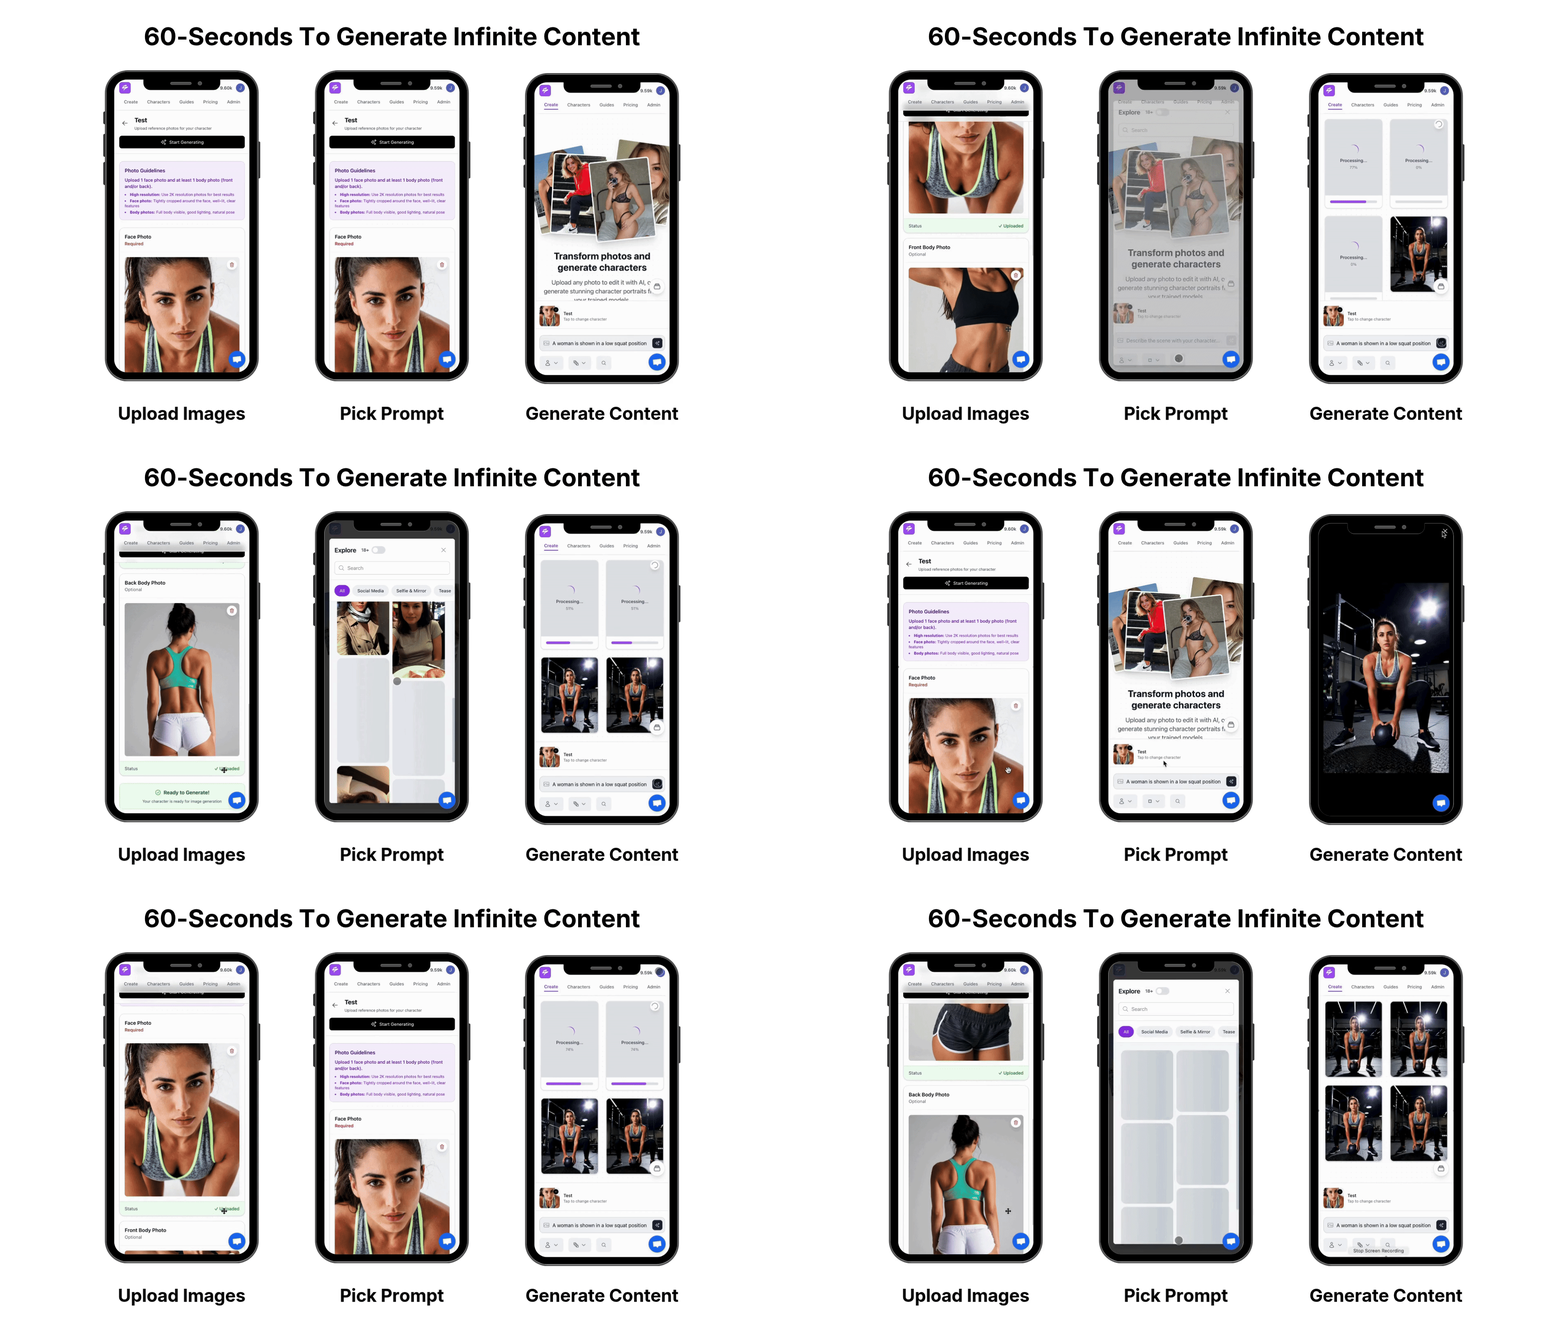
For agencies, Sozee’s isolated team workspaces keep each client account’s characters, vault, connected accounts, and credits separate. This separation preserves the tracking-link integrity that makes cohort attribution reliable. The Agent layer turns a rough content idea into a fully scheduled, captioned post without manual prompt engineering, which cuts per-account production time from hours to minutes.
Frequently Asked Questions
How do content-category breadth and format diversity affect Fanvue subscriber retention?
Subscribers who engage with multiple content categories retain longer than those focused on a single format. Cross-topic breadth predicts long-term retention more effectively than posting volume because it increases the number of chances a creator has to stay relevant as subscriber interests shift. On Fanvue, new subscribers often exhaust novelty in a single-format feed within two to three weeks. Adding a second layer, such as voice notes, serialized PPV arcs, exclusive tiers, or behind-the-scenes content, extends the subscriber’s reason to stay beyond month one, which remains the highest-churn window on the platform.
What revenue patterns appear when creators test multiple PPV price tiers?
PPV revenue share rises with creator earnings tier. It accounts for about 18% of revenue for creators earning under $200 monthly but about 44% for those earning over $20,000 monthly. Testing multiple price points shows that the $9–$25 range converts 18–24% of an active subscriber base within 14 days. Bundling three recent PPVs at a 35–40% discount usually increases total PPV revenue by 12–18%. Lifecycle-specific pricing also matters. Day-one subscribers often accept premium PPV pricing due to novelty, while month-three subscribers respond better to relationship-driven, lower per-unit pricing that avoids churn. Price tests that ignore subscriber tenure often produce misleading conversion data.
How can agencies scale API-level attribution without custom engineering?
Agencies can reach reliable attribution at scale with a three-layer stack that needs no custom development. First, use unique tracking links per traffic source with standardized UTM naming conventions. Second, classify fans within a CRM that tags each subscriber by acquisition source at the moment of subscription. Third, build cohort dashboards that track 30-, 60-, and 90-day LTV per source. Consistency matters most. UTM naming must follow one documented convention across all team members, and tracking links must never be reused across sources. Fanvue’s native analytics surface retention and PPV conversion data per account, while the attribution layer maps that data back to the external channel that drove each subscriber cohort.
What weekly metrics best predict month-two retention on Fanvue?
The strongest predictors of month-two retention are first-72-hour engagement rate, PPV purchase within the first 48 hours, and format diversity consumed in the first 30 days. Subscribers who make their first PPV purchase within 48 hours of subscribing reach a 60–70% first-month renewal rate, compared with roughly 40% for those who never purchase PPV. Voice notes sent within the first 72 hours create an 8–20 percentage point lift in month-two retention compared with text-only funnels. On a weekly review cadence, focus on Day-7 retention rate for the current cohort, PPV conversion rate for the first offer sent, and ARPU for the cohort’s first week, then compare those metrics with the prior cohort’s equivalent window.
The Future of Data-Driven Diversification in the Creator Economy
Analytics-led content strategy is shifting from a competitive edge to a basic operating requirement on Fanvue. As the platform’s creator count moves toward and beyond 250,000, the gap will widen between creators who translate data into diversified output and those who post by instinct. The research cited earlier confirms what these frameworks put into practice. Creators and agencies that convert engagement breadth into diversified content will compound their retention advantage month after month.