Key Takeaways
- Track six core content metric categories to scale without burnout: Consumption, Engagement, Conversion, Production, SEO/Discoverability, and Goal Frameworks.
- 2026 benchmarks for mid-tier creators show strong performance with under 40% bounce rate, 5%+ engagement rate, 2%+ CTR, and 10K+ monthly views.
- Production metrics such as output rate and cost per piece are critical. AI tools can deliver 10x more content while saving over 20 hours each week.
- Use frameworks like the 70-20-10 rule and the 5 C’s (Clarity, Consistency, Creativity, Community, Conversion) to connect KPIs to revenue.
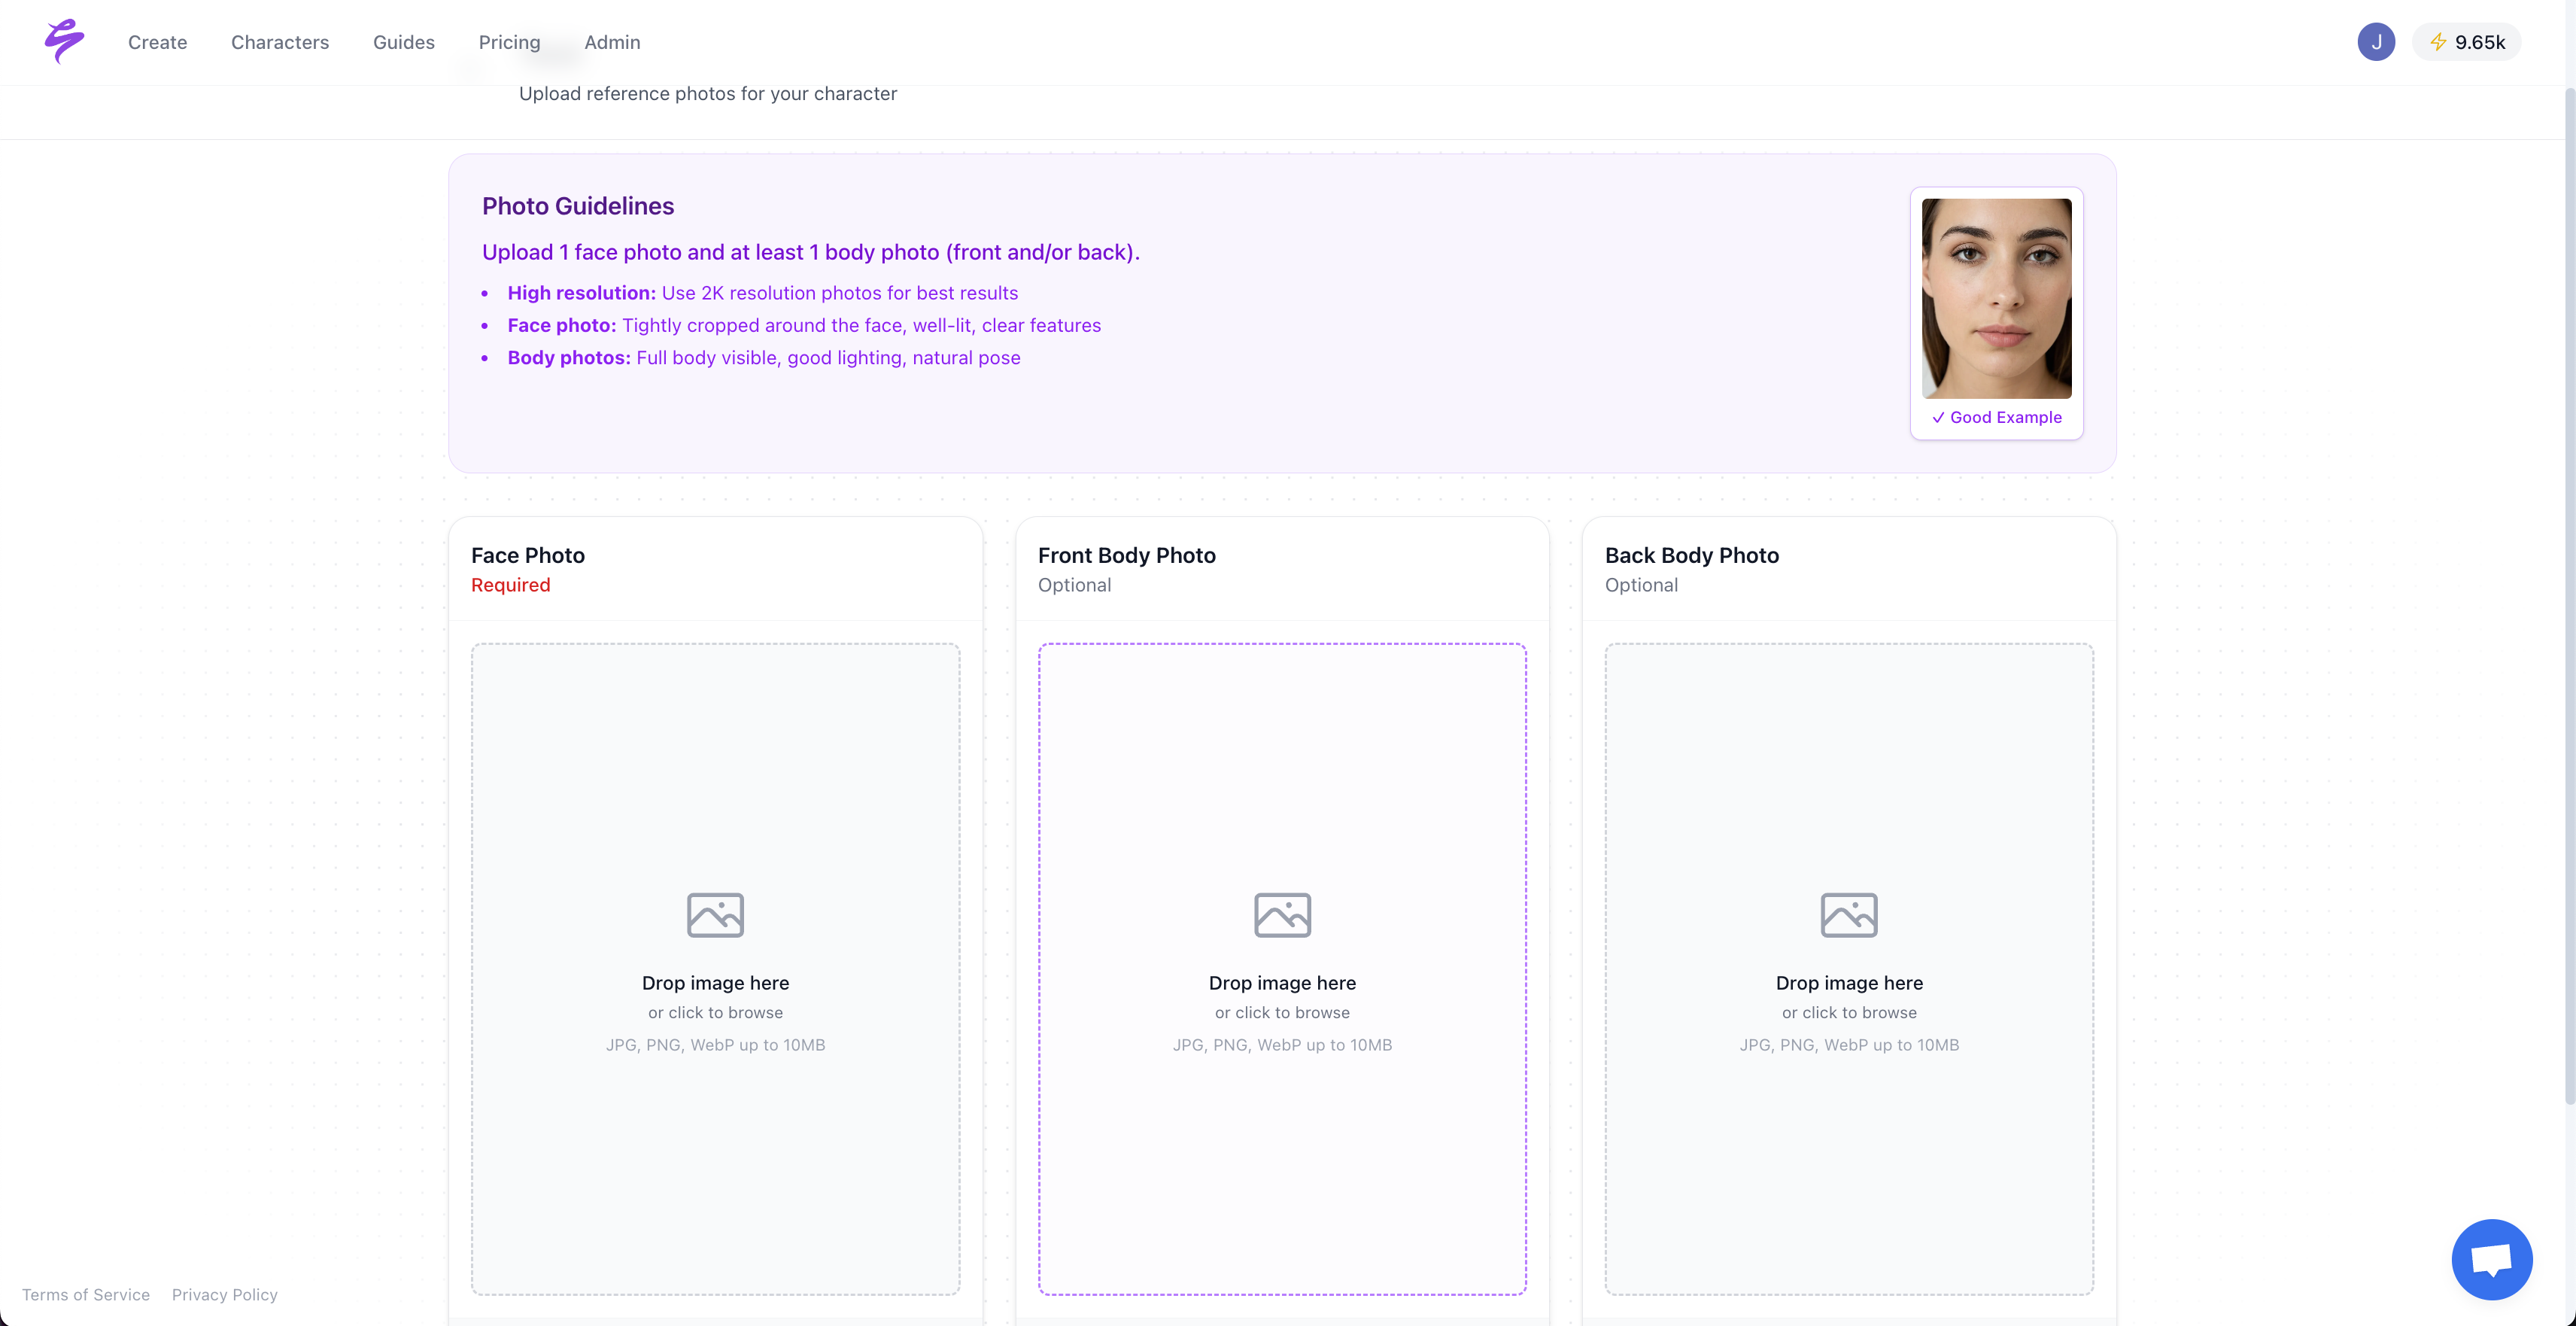
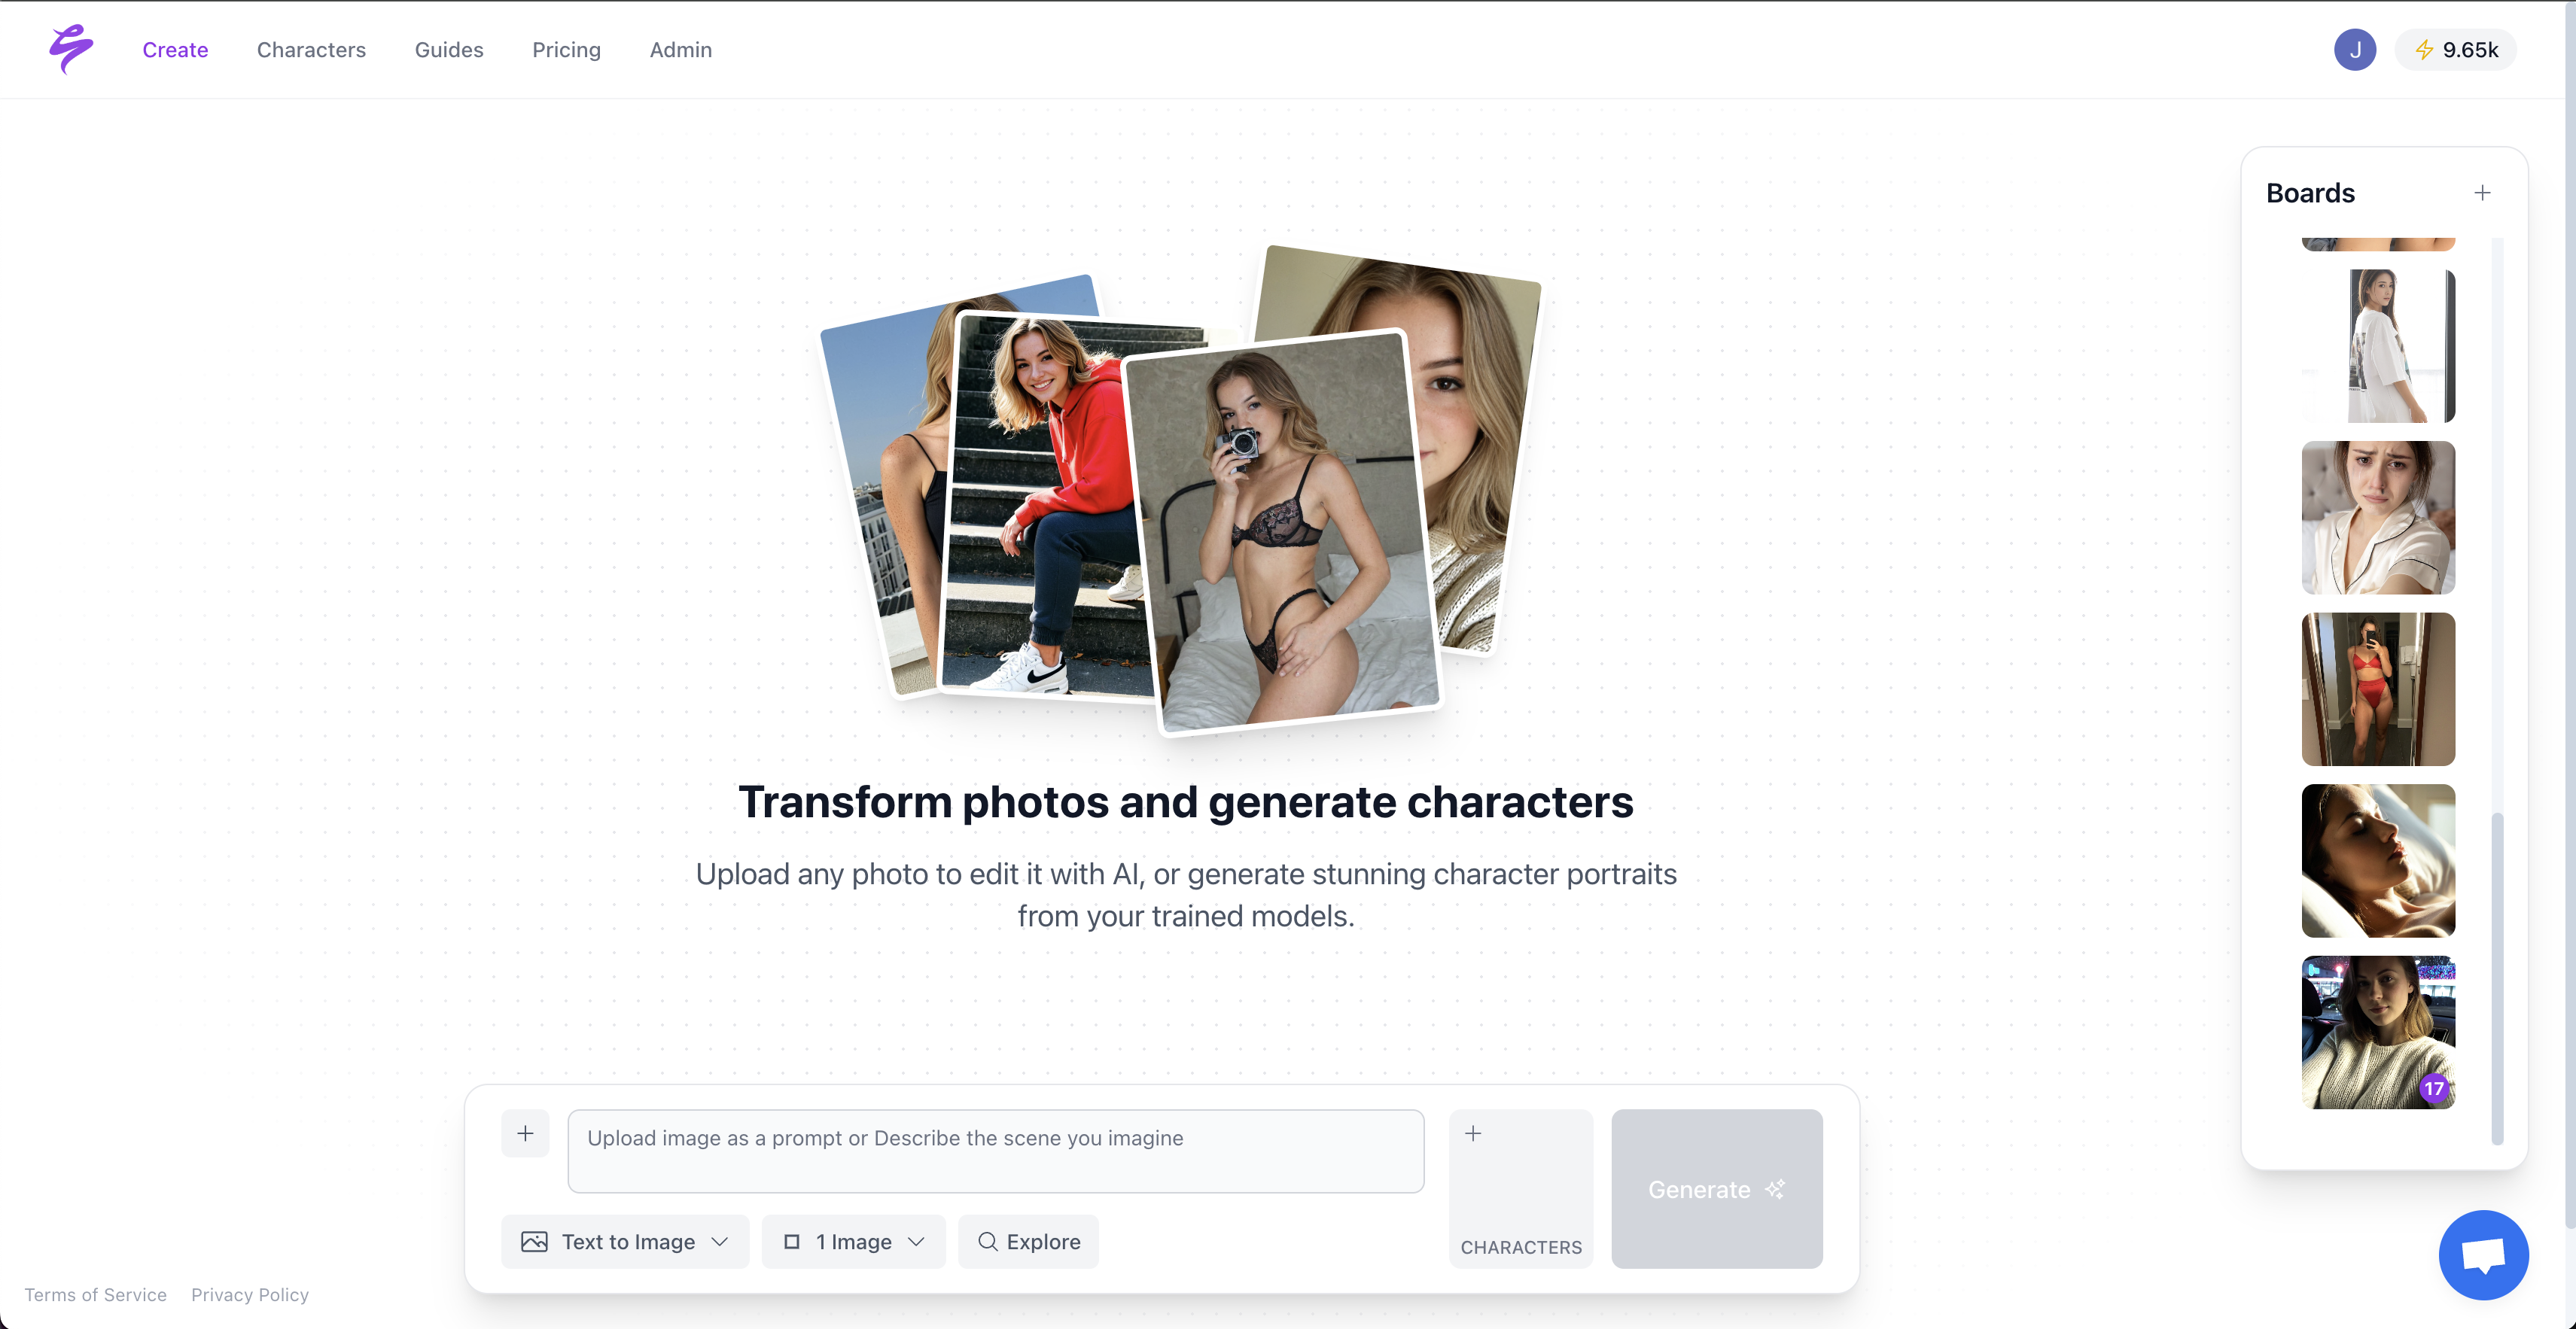
- Supercharge your metrics with Sozee.ai. Upload three photos, generate infinite AI content, and measure your performance lift.
🔥 Consumption Metrics: 10 KPIs to Track Views and Traffic Quality
Consumption metrics show how many people discover and view your content. These numbers define your reach and set the ceiling for monetization.
- Pageviews: Total content loads across all platforms
- Unique Visitors: Individual users consuming your content
- Traffic Sources: Where your audience discovers you (organic, social, direct)
- Average Session Duration: Time users spend engaging with your content
- Bounce Rate: Percentage of single-page visits
- Return Visitor Rate: Percentage of repeat audience
- Mobile vs Desktop Split: Device preference insights
- Geographic Distribution: Location-based audience data
- Peak Viewing Times: When your audience is most active
- Content Depth: How many pieces users consume per session
Three core consumption metrics act as your early warning system for content health. Bounce rate, monthly views, and session duration show whether your content attracts and holds attention.
| Metric | Good 2026 Benchmark | Red Flag | Source |
|---|---|---|---|
| Bounce Rate | <40% | >60% | Semrush |
| Monthly Views (Mid-tier) | 10,000+ | <1,000 | InfluenceFlow |
| Session Duration | 3+ minutes | <1 minute | Count.co |
TikTok creators using AI-generated teasers to drive traffic to premium content often see sharp pageview spikes. However, traffic spikes mean little when visitors do not stay or return. High traffic with low engagement or sudden drops in return visitors signal that content is not resonating.
Use Google Analytics 4 to track these patterns and see which traffic sources bring engaged visitors instead of empty clicks. Once you understand who views your content and how they arrive, you can move to measuring how deeply they interact with it.
💬 Engagement Metrics: 10 KPIs for Interactions and Retention
Engagement metrics reveal how strongly your audience connects with your content. These interactions drive algorithm reach and long-term fan loyalty.
- Time on Page: Average duration users spend consuming content
- Social Shares: Content amplification across platforms
- Comments: Direct audience feedback and conversation
- Likes/Reactions: Quick engagement indicators
- Scroll Depth: How far users consume long-form content
- Video Completion Rate: Percentage watching full videos
- Save/Bookmark Rate: Content users want to revisit
- Click-through Rate: Links and CTAs clicked within content
- Engagement Rate: Total interactions divided by reach
- Response Rate: How quickly you engage back with your audience
TikTok engagement rates above 5% indicate strong performance, while rates below 2% with heavy posting suggest content fatigue. Agencies managing five or more creators find that steady engagement across talent signals sustainable growth.
Focus on meaningful interactions instead of vanity metrics such as raw follower counts. Strong engagement sets up the next stage, where you convert attention into revenue.
💰 Conversion Metrics: 10 KPIs for Revenue and ROI
Conversion metrics connect content performance directly to revenue. These KPIs show how effectively your content turns attention into income.
- Click-through Rate (CTR): Percentage clicking your calls-to-action
- Lead Generation: Email signups, DMs, or contact form submissions
- Return on Investment (ROI): (Revenue – Cost) / Cost formula
- Cost Per Lead (CPL): Marketing spend divided by leads generated
- Pay-Per-View Revenue: Premium content monetization
- Subscription Conversion: Free-to-paid user transitions
- Average Order Value: Revenue per transaction
- Customer Lifetime Value: Total revenue per fan relationship
- Churn Rate: Percentage of subscribers canceling
- Revenue Per Follower: Total income divided by audience size
| Metric | Good 2026 Benchmark | Red Flag | Source |
|---|---|---|---|
| Meta CTR | 2%+ | <1% | Adamigo |
| OnlyFans PPV Revenue | $5,000+/month | <$1,000/month | Industry Standard |
| Email CTR | 2.62%+ | <1% | InsiderOne |
OnlyFans creators with clear conversion funnels usually enjoy more stable revenue. High traffic with weak conversion rates points to an audience mismatch or a broken monetization strategy.
Once your conversion engine works, your next growth lever becomes production efficiency. You need to create more winning content without burning out.
⚙️ Production Metrics: 10 KPIs to Protect Creators from Burnout
Production metrics track how efficiently and sustainably you create content. These KPIs often decide whether a creator scales or stalls.
- Output Rate: Content pieces produced per time period
- Cost Per Content Piece: Total production expenses divided by output
- Consistency Score: Posting schedule adherence percentage
- Content Quality Index: Performance metrics averaged across pieces
- Burnout Indicators: Declining output or engagement over time
- Time to Publish: Creation to live content duration
- Revision Cycles: Average edits before final approval
- Asset Reuse Rate: Percentage of repurposed content elements
- Creator Satisfaction: Self-reported energy and motivation levels
- Scalability Index: Output increase without proportional time investment
AI-powered content creation saves about 20 hours per week while enabling five to ten times more variations per cycle. Traditional photo shoots often cost $50 or more per piece, while AI generation can reach similar quality at under $1 per post.
Sozee reshapes production metrics by reconstructing your likeness from just three photos, which removes the need for constant new shoots. This single upload unlocks unlimited hyper-realistic content for OnlyFans, TikTok, and Instagram, directly improving output rate and cost per piece.
These efficiency gains, including the 20+ weekly hours saved mentioned earlier, reduce burnout signals while keeping engagement quality steady. Creators also see clear jumps when they compare pre-Sozee output to post-Sozee scaling.
📈 SEO and Discoverability Metrics: 10 KPIs for Organic Growth
SEO and discoverability metrics show how easily new audiences find your content through search engines and platform algorithms.
- Organic Search Rankings: Position for target keywords
- Backlink Velocity: Rate of new sites linking to your content
- Organic Traffic Growth: Search-driven visitor increases
- Zero-Click Engagement: Interactions without site visits
- AI Visibility Score: Presence in AI-powered search results
- Featured Snippet Captures: Content appearing in answer boxes
- Social Platform Reach: Algorithm-driven content distribution
- Brand Mention Frequency: Organic references across platforms
- Content Freshness Index: How recently content was updated
- Cross-Platform Syndication: Content reach across multiple channels
AI Overviews reduce traditional search CTR by about 65%, which makes brand visibility and citation frequency more valuable than raw click-through rates. Creator content now anchors many LLM query results, positioning creators as a core search layer across social and AI platforms.
Use tools such as Semrush and Ahrefs to monitor these discoverability patterns and see how your content surfaces across channels. Tracking this many metrics can feel overwhelming, so you need clear frameworks that show what to prioritize.
🎯 Goal Frameworks and Templates: Turn Metrics into Revenue
Goal frameworks connect your metrics to business outcomes. These approaches help you focus on content that reliably drives revenue.
- 70-20-10 Rule: 70% proven content, 20% promotional, 10% experimental
- 5 C’s Framework: Clarity, Consistency, Creativity, Community, Conversion
- Content Pyramid: Foundation content supporting premium offerings
- Funnel Metrics Alignment: Awareness, consideration, conversion, retention
- Revenue Attribution Model: Tracking content’s direct income impact
The 70-20-10 rule supports steady growth while you test new ideas in a controlled way. OnlyFans creators using this mix often report more predictable revenue than those posting without a plan.
The 5 C’s framework adds quality standards on top of that mix. Clarity in messaging, Consistency in posting, Creativity in approach, Community engagement, and Conversion focus work together to keep content both effective and on-brand.
Use these frameworks side by side. The 70-20-10 rule guides how much of each content type you publish, while the 5 C’s define how each piece should perform.
| Metric Category | Revenue Impact | Tracking Priority | Benchmark Target |
|---|---|---|---|
| Consumption | Awareness | High | 10K+ monthly views |
| Engagement | Consideration | High | See engagement benchmarks above |
| Conversion | Revenue | Critical | Strong CTR relative to platform norms |
| Production | Efficiency | Medium | 10x output increase |
Frequently Asked Questions
What is a KPI for content creators?
A KPI for content creators is a measurable metric that directly affects revenue or growth. Core KPIs include production output rate, engagement rate, conversion rate, and revenue per follower.
Production metrics often receive less attention, yet they reveal how much content you create compared to time invested. This data shows your true scaling potential. Successful creators track both consumption metrics such as views and traffic, and efficiency metrics such as cost per content piece and time to publish, so they can grow income without burning out.
What is a content creation metrics template?
A strong content creation metrics template tracks six categories. These are Consumption (pageviews, unique visitors), Engagement (time on page, social shares), Conversion (CTR, revenue), Production (output rate, cost per piece), SEO (organic rankings, backlinks), and Goal Alignment (70-20-10 rule adherence).
Create a monthly scorecard with benchmark targets, your actual performance, and revenue correlation for each metric. Add red flag thresholds such as bounce rates above 60% or engagement rates below 2% so you can spot problems early.
What are the 5 C’s of content creation?
The 5 C’s of content creation are Clarity, Consistency, Creativity, Community, and Conversion. Clarity keeps your message sharp for your target audience, while Consistency builds trust through regular posting and a stable brand voice.
Creativity helps your content stand out in crowded feeds. Community focuses on engagement and loyalty through real interactions. Conversion turns attention into revenue through clear calls-to-action and monetization funnels. Top creators work across all five areas instead of relying only on creativity or consistency.
What is the 70-20-10 rule in content?
The 70-20-10 rule guides how you allocate content efforts. Seventy percent goes to proven content that performs well, 20% to promotional content that drives direct sales, and 10% to experimental content that tests new formats or topics.
This structure prevents constant trend chasing and supports stable revenue. The 70% foundation covers your best-performing content types, the 20% promotional slice includes launches or paid content teasers, and the 10% experimental slice lets you innovate without risking your core strategy. Many OnlyFans creators using this rule report steadier monthly earnings.
What are examples of social media metrics?
Key social media metrics include engagement rate (likes, comments, shares divided by reach), reach (unique accounts that see your content), and impressions (total content views). Click-through rate measures link clicks divided by impressions, and conversion rate tracks desired actions divided by total visitors.
Platform-specific metrics also matter. TikTok completion rates, Instagram story completion rates, YouTube watch time, and OnlyFans tip frequency all reveal how content performs in context. Track metrics that correlate with revenue instead of relying on follower count alone.
The 2026 content landscape rewards creators who track metrics across consumption, engagement, conversion, production, SEO, and goal alignment. The ten core metrics that matter most span all six categories: pageviews, engagement rate, CTR, output rate, cost per content, organic rankings, revenue per follower, consistency score, AI visibility, and ROI attribution.
Traditional approaches focus on surface metrics and ignore production efficiency, which often separates creators who scale from those who burn out. AI-powered content generation changes that equation by allowing output to grow without matching time increases.
Sozee.ai reconstructs your likeness from three photos and generates unlimited hyper-realistic content for any platform while you track efficiency gains and revenue growth. Updated April 2026 benchmarks confirm that these production gains hold across creator tiers and platforms.