
Key Takeaways
- A UGC creator analytics dashboard brings performance, commercial, and workflow data from every platform into one view so posting and brand-deal decisions use a single source of truth.
- Group metrics into three buckets, performance, commercial, and workflow, so every number can directly influence what gets posted, pitched, or dropped.
- Platform APIs differ dramatically across TikTok, Instagram, and YouTube, so plan for missing fields, changing endpoints, and manual-entry fallbacks.
- Use a spreadsheet for roughly 3–10 active deals, then move to a dedicated tool once manual tracking time exceeds the cost of software.
- Ready to close the loop from production to publication to measurement? See how Sozee connects your scheduler to your analytics.
The Metric Set: Three Buckets Every UGC Analytics Dashboard Needs
A creator analytics dashboard earns its place only when every number on it can change what gets posted, what gets pitched, or what gets dropped. Organize the metric set into three buckets so the data model stays easy to query and simple to cite.
Performance Metrics
The core performance fields are impressions, reach, views, likes, comments, shares, saves, watch time, and engagement rate. Engagement rate needs an explicit operational definition because the denominator differs by platform. TikTok calculates engagement rate against views (play_count), not impressions or followers. Instagram’s native analytics surfaces engagement as interactions (likes + comments + saves + shares) divided by reach, not followers, and it provides raw counts rather than a named engagement-rate metric. Some tools calculate engagement rate against follower count instead.
A UGC creator analytics dashboard needs to store the formula alongside the number so the trend line stays honest. A rate of 4% against views differs completely from 4% against followers.
Platform metric availability is not uniform, and the gap is large enough to change how you design the dashboard. Across nine social platforms scored on nine metric concepts for a single owned organic post, only Instagram and Facebook report seven of nine concepts, while TikTok and Threads report only four. That spread means a dashboard built for one platform will show empty columns on another. Saves, for example, are available on Instagram and X but not on TikTok via its public API. Build the dashboard expecting some cells to stay empty for specific platforms.
Commercial Metrics
For a solo creator, the commercial bucket includes revenue per deal, revenue per production hour, effective CPM, deal pipeline stage, deliverable completion rate, and payout status. Of these, revenue per production hour is the one that changes decisions. Raw revenue shows what a deal paid. Hours per deliverable show whether the time spent made sense.
The gap can be wide. Effective hourly rates for UGC creators range from $25–$75/hour on marketplace rates and $100–$400/hour on direct client rates. A creator who tracks hours per deliverable can see immediately which deal types deserve another round.
Usage rights belong as a separate commercial line item. UGC usage rights for paid ads commonly add roughly 30–50% to the base creation fee per 30-day window, with published benchmarks from about 20% to 50% per month depending on the source. Whitelisting, where the brand runs ads from the creator’s handle, appears as an additional recurring monthly fee. A dashboard that tracks only the base fee understates deal value and drives re-booking decisions from incomplete data.
For brand and agency operators, add blended CPM (total included cost divided by total eligible impressions multiplied by 1,000), cost per approved asset, creator leaderboard rankings, spend against budget, and payout reconciliation across creators. Use actual approved and reconciled cost from the creator-payment ledger rather than early estimates so production fees, usage, bonuses, and reversals stay traceable to the campaign.
Workflow Metrics
Workflow fields track the operational health of the deal pipeline. They include assets delivered versus contracted, revision rounds, approval turnaround, posting cadence adherence, and content-to-deal attribution. For agencies, add approval rate (approved deliverables divided by submitted deliverables), on-time rate, and revision rate. A campaign report is incomplete if it shows views but not whether the contracted work shipped.
If you prefer a ready-made pipeline, use Sozee to manage production, scheduling, and measurement in one place.
Where The Data Actually Comes From: Platform Data-Access Reality
Each platform exposes a different slice of data through its native surface and its API, and the gap between what you see in-app and what you can pull programmatically is significant. Build the dashboard with these constraints in mind before you choose a tool.
TikTok
TikTok’s in-app Analytics (Creator Tools → Analytics) is available only to Business Accounts. It shows 7-day or 28-day summaries of video views, profile views, likes, comments, shares, and follower growth, plus per-video performance including total views, average watch time, traffic source, and audience territories. It excludes paid campaign data, conversion tracking, and API access, and it offers no raw data export.
The TikTok Display API is read-only for the authenticated user’s own account, requires each user to authorize individually through OAuth, and cannot monitor competitors or arbitrary public accounts. The Video Query endpoint returns only four post-level metrics: view_count, like_count, comment_count, and share_count, with no impressions, reach, watch time, completion rate, or saves. A brand tracking 20 creators cannot pull per-video retention or audience demographics programmatically. TikTok’s standard commercial API endpoints also return no audience demographic breakdowns such as age, gender, or location.
TikTok introduced a Creator Search Insights API in 2026 that returns creator-level data without requiring individual OAuth. It returns follower count ranges rather than exact figures, so dashboards still need another source for precise follower numbers and full historical depth.
Meta shut down the Instagram Basic Display API on December 4, 2024. As of 2026, Instagram API access runs through the Instagram Graph API and the Instagram API with Instagram Login. Both require a Business or Creator account linked to a Facebook Page. The Graph API returns impressions, reach, profile visits, and per-post engagement for connected accounts. As of Instagram Graph API v22.0, impressions was deprecated and enforced from April 21, 2025, which creates a date seam in historical data.
Several metrics were deprecated in January 2025 starting with API version v21. video_views for non-Reels content, email_contacts, time-series profile_views, website_clicks, phone_call_clicks, and text_message_clicks now return empty or error responses. Instagram follower demographic insights (age, gender, country, city) were removed from the self-serve public Graph API and remain available only in Meta Business Suite and the Instagram Professional Dashboard.
Stories data disappears from the Graph API after 24 hours. Any dashboard that tracks historical story views, reach, exits, or link clicks needs a background polling job that fetches story data throughout the day before it expires. As of June 2026, Instagram updated how Total Views, Reactions, and Comments are returned via its APIs to include views and engagements generated from cross-posted Facebook content. That change can inflate total engagement numbers compared to earlier reporting.
YouTube
YouTube Studio and the YouTube Analytics API provide the richest retention data of the three platforms. Watch time, average view duration, retention curves, and traffic sources are all available for your own channel. The channel owner gets shares, estimatedMinutesWatched, averageViewDuration, averageViewPercentage, and dislikes via the YouTube Analytics API, while any API key holder can access viewCount, likeCount, and commentCount. However, YouTube Studio’s headline Impressions figure has no matching metric on the YouTube Analytics API metric list. The thumbnail impression number shown in Studio is not directly accessible via API.
YouTube Data API v3 returns Shorts and long-form videos together with no API-level filter to separate them, which complicates analytics segmentation. Search requests cost 100 quota units each against a daily budget of 10,000 units, so free-tier builders get roughly 100 searches per day.
Platform APIs and analytics surfaces change frequently, and the examples above are documented as of mid-2026. Any UGC creator analytics dashboard needs a manual-entry fallback and a quarterly check of what each platform still exposes.
How To Create a UGC Creator Analytics Dashboard (Spreadsheet-First)
For a solo UGC creator tracking 3–10 active deals, a spreadsheet is the right starting point. Build three tabs.
Tab 1 — Deliverables: One row per deliverable. Columns:
- Platform
- Post date
- Format (Reel, TikTok video, YouTube Short, etc.)
- Impressions (platform-reported only)
- Reach (platform-reported only)
- Engagement rate (with formula noted, for example likes + comments + shares ÷ reach)
- Deal ID
- Fee (base)
- Usage rights fee (separate column)
- Production hours
- Payout status
Tab 2 — Deal Pipeline: One row per deal, with columns for brand name, platform, deliverable count, contracted fee, usage rights scope, pipeline stage, and next action.
Tab 3 — Weekly Rollup: A simple summary of revenue collected, revenue pending, deliverables live, deliverables in production, and average engagement rate by platform for the trailing 30 days.
The manual-entry cadence should be weekly on the same day at the same time. That consistency matters because spreadsheets fail through small, accumulating errors such as wrong formulas, mismatched metric definitions, or stale pastes. Those errors blend into a number that looks authoritative while being wrong. The rule that prevents this is simple. Never mix platform-reported reach with manually estimated reach in the same column, and label the source of every figure.
The graduation threshold is a decision about cost, not a ranking of tools. At $40/hour for a coordinator’s time, a team spending 5 hours per week on manual tracking incurs $800 per month in labor, while a $50–$200 per month analytics tool pays for itself immediately. When deal volume, creator count, or platform count crosses the point where manual entry costs more hours than a dedicated tool costs money, it is time to move. Explore Sozee when your spreadsheet starts to feel like a second job.
When To Graduate To a Dedicated UGC Creator Analytics Dashboard
Five inflection points signal a spreadsheet has hit its ceiling: tracking more than 10 creators, being active on 2+ platforms, receiving repeated ad-hoc data requests, having lost data or overwritten formulas, and being unable to answer “which creator should we re-book?” The cost math from the previous section is one signal, and these operational inflection points usually show up first.
Sozee is the recommended first option for creators and agencies at this threshold. Its native Analytics covers impressions, reach, likes, comments, shares, and engagement, with a split between what Sozee posted and what the creator posted so the platform’s contribution stays visible. That split directly supports the re-booking question because performance by creator and by channel appears in a single view.
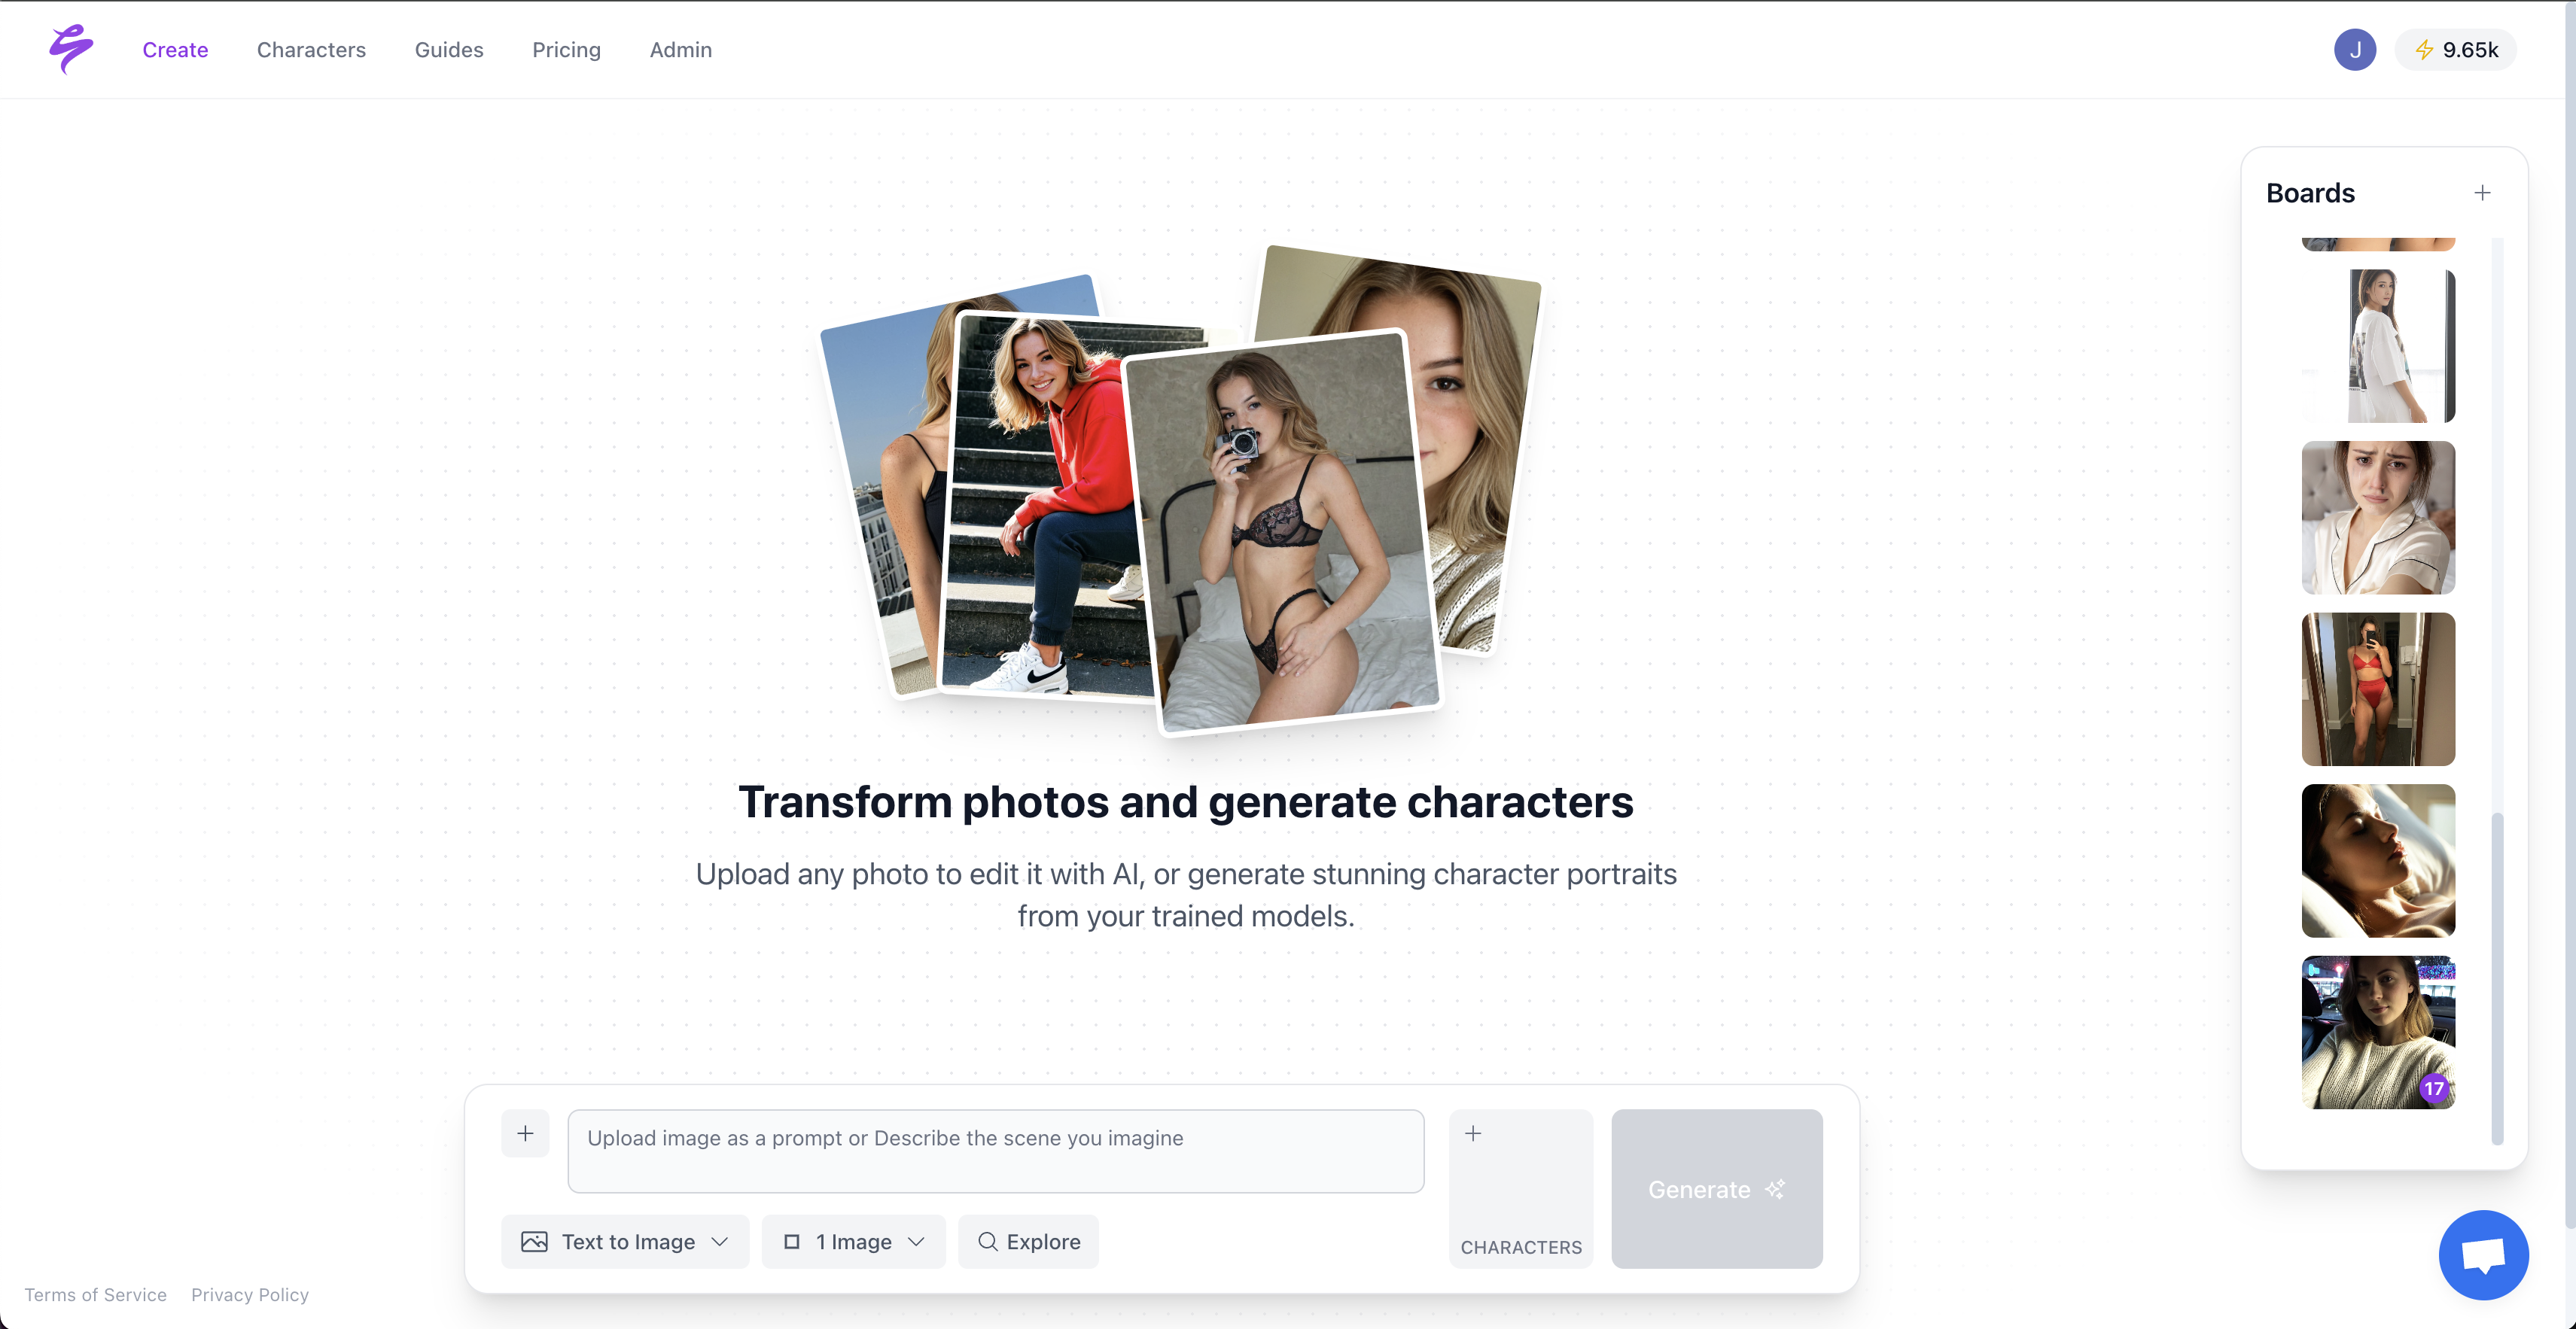
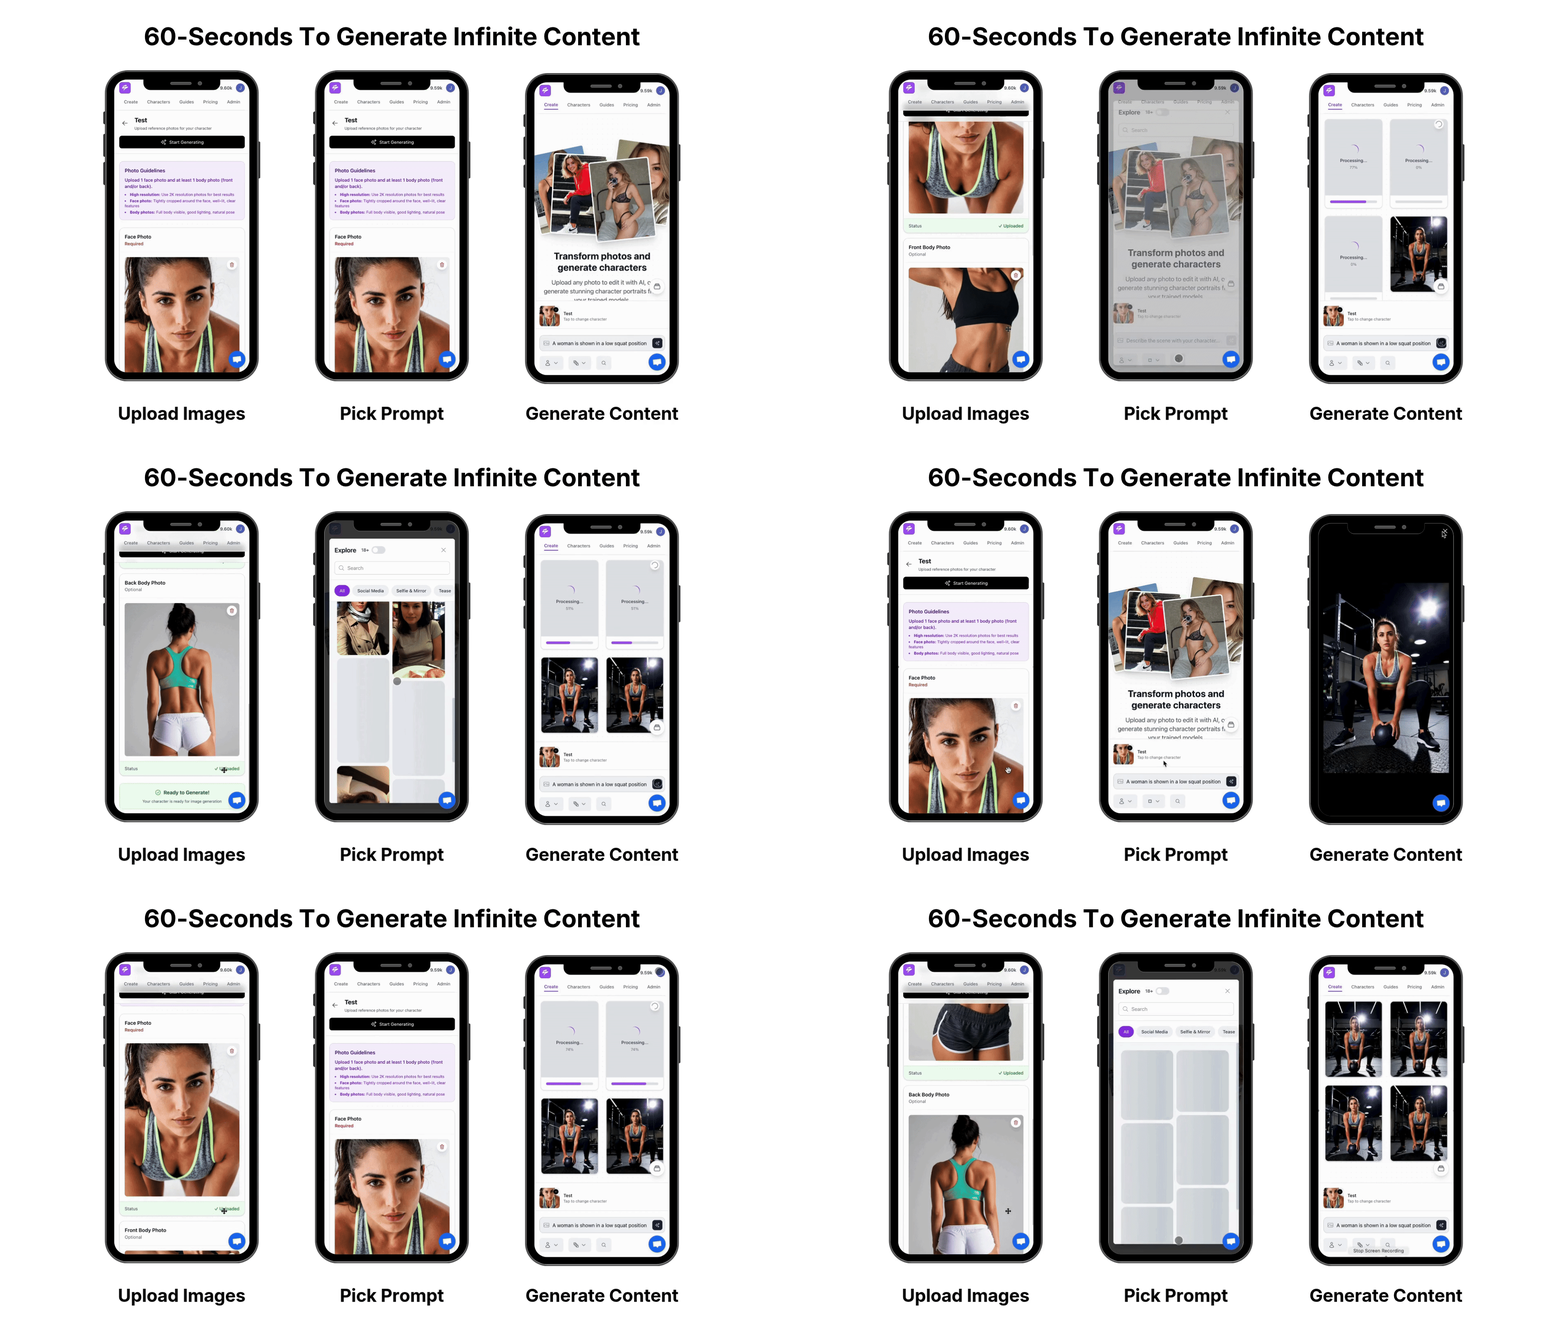
The Scheduler connects Instagram, TikTok, X, Facebook, Reddit, and Fanvue per character so posting and measurement live in the same place. The Vault organizes every image, video, voice note, and Live Mode snap in folders that feed the Scheduler and the Agent. The Agent (Copilot) reads characters, the library, and performance to propose and produce the next post, writing the caption and scheduling it inside the conversation.
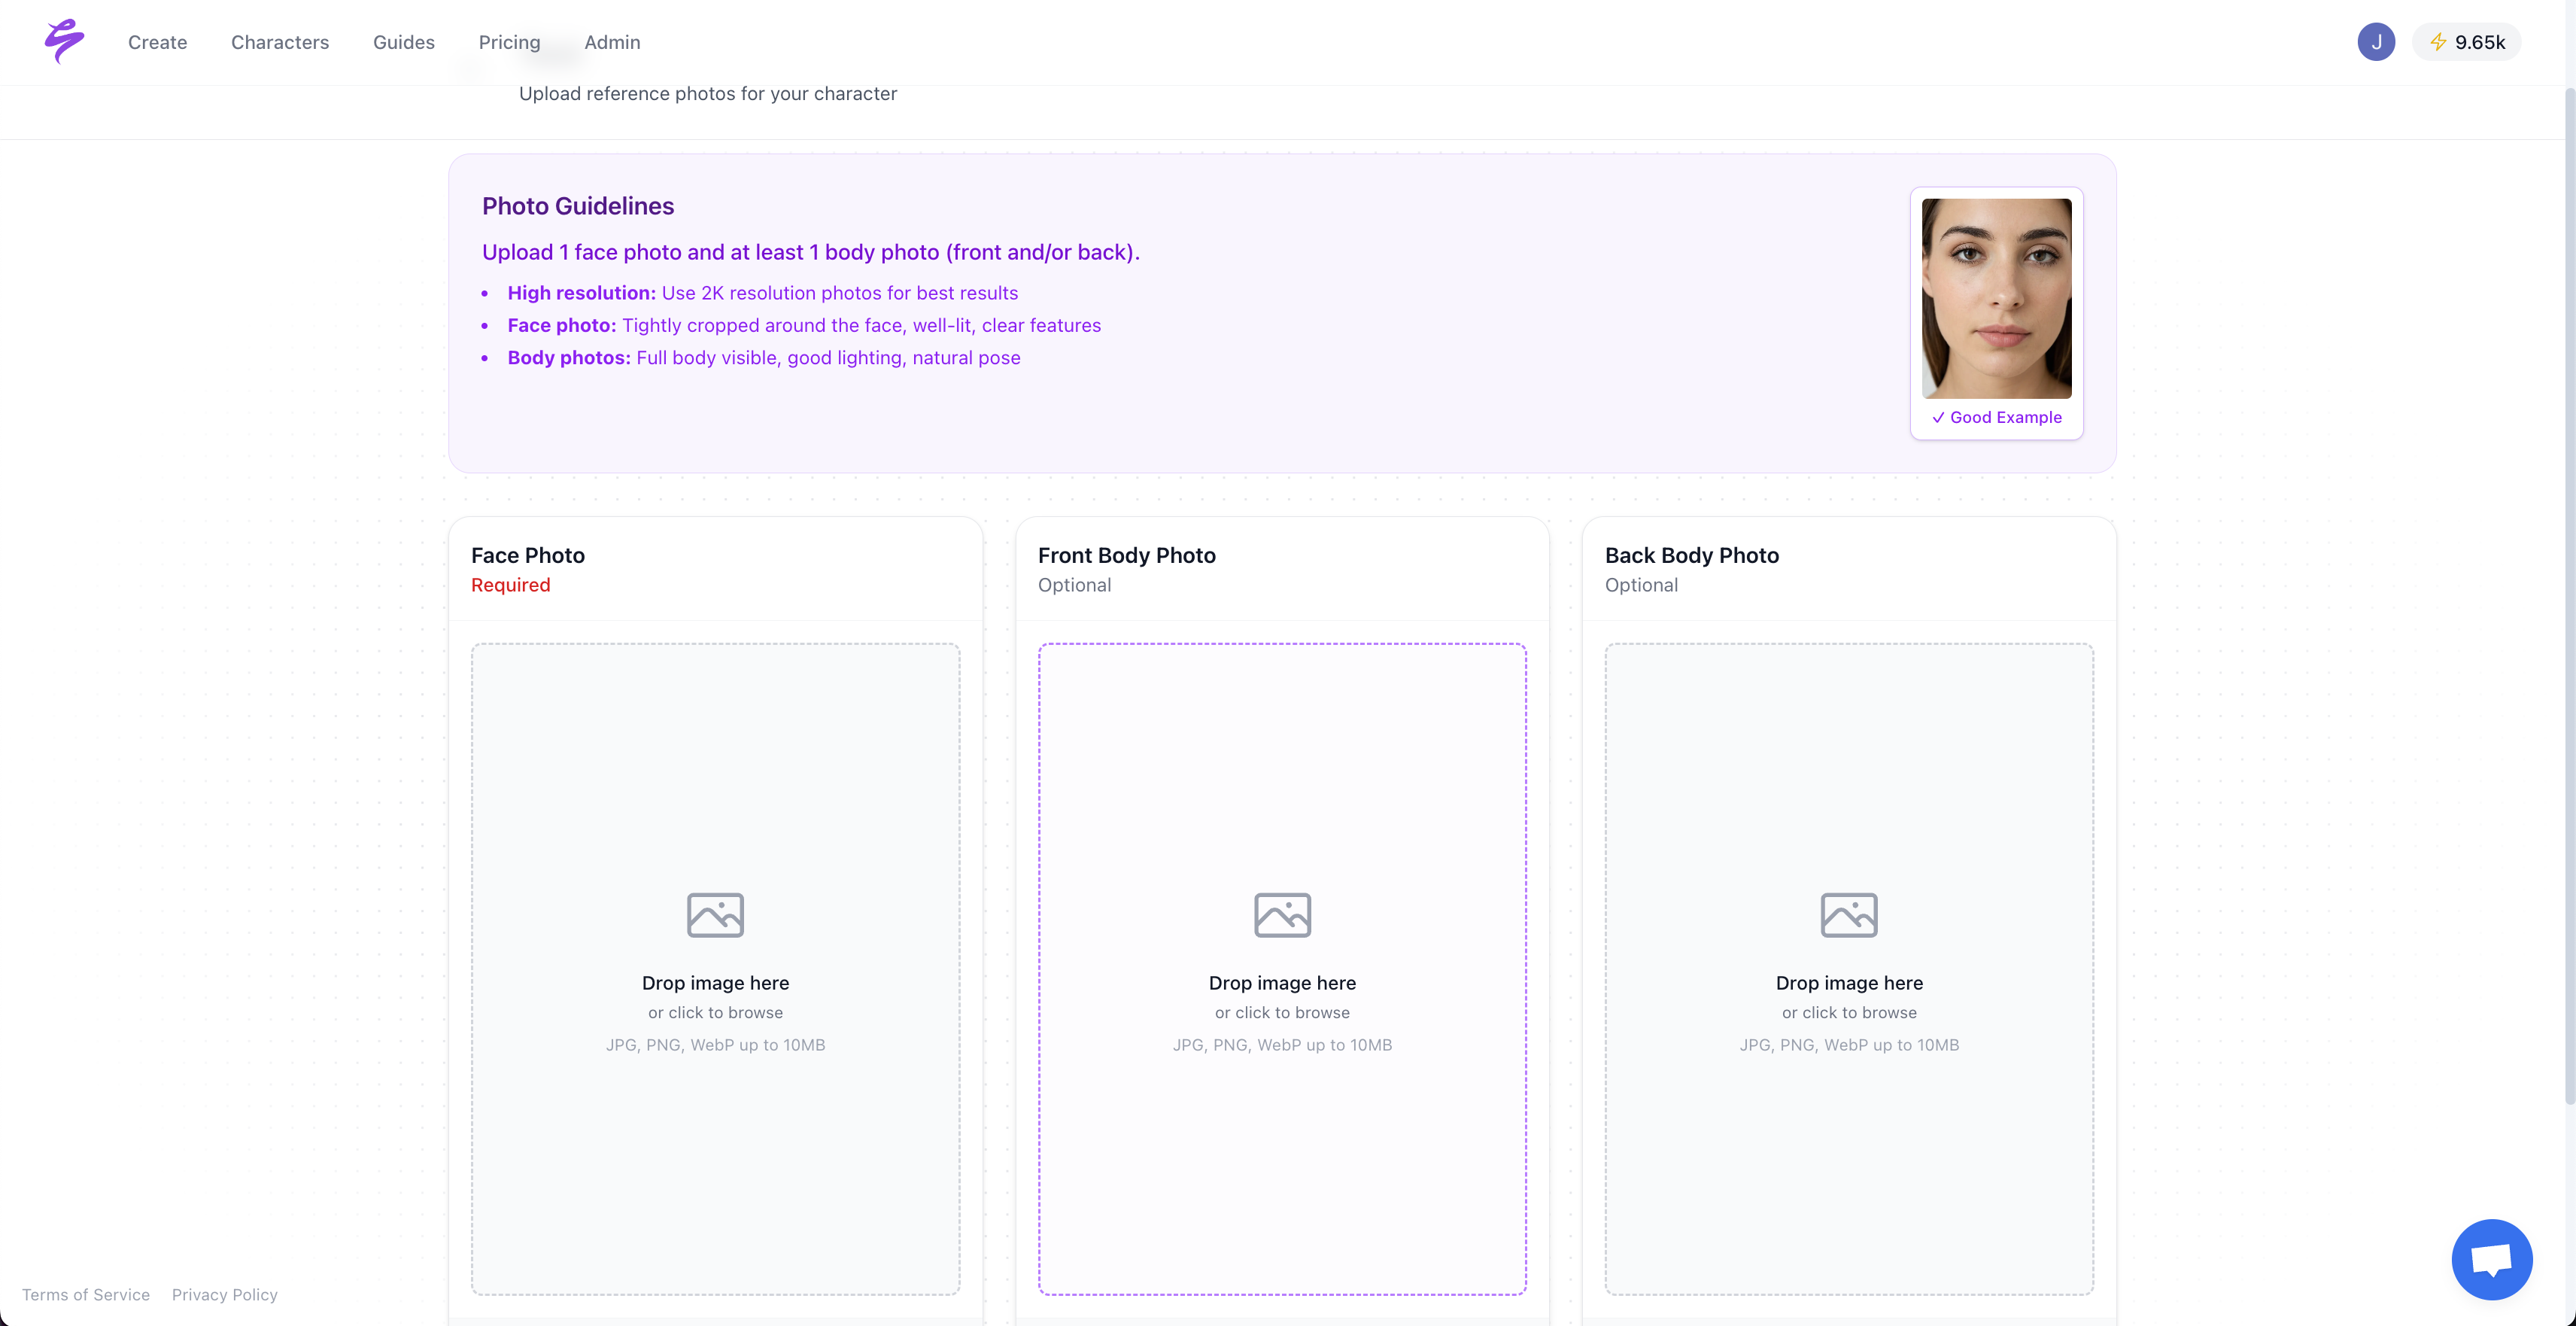
For agencies running a roster from one login, Teams and isolated workspaces keep every client’s characters, vault, connected accounts, and credits fully separated. This structure addresses the remaining inflection points: multi-client complexity, repeated data requests, and the risk of overwriting formulas in shared spreadsheets.
These pieces together close the loop from production to publication to measurement in one platform. The UGC analytics dashboard is native to the workflow that generates the content, not a separate reporting layer bolted onto a content tool.
What To Ignore
Not every metric on a creator analytics dashboard changes a decision. The ones that do not belong there share a pattern.
- Follower count as a primary commercial signal. A 50,000-follower creator with 8% engagement can out-earn an 80,000-follower creator at 1.5% engagement because brands buy attention rather than follower counts.
- Vanity impressions totals without a cost or conversion denominator, where impressions without blended CPM or cost per view are decorative.
- Engagement rate without the formula stored alongside it, because a rate calculated against followers is not comparable to one calculated against reach.
- Dashboard features that exist to look impressive in a demo but produce no actionable output. The test is simple: if a leaderboard has no tie to rebooking decisions, a trend chart has no threshold line, or a metric tile has no defined action when the number moves, it is decoration.
The same test from the metric-set section applies here. If a metric cannot change what gets posted, pitched, or dropped, remove it.
Frequently Asked Questions
How Do I Create an Analytics Dashboard?
Start with a spreadsheet. Use one tab for deliverables with one row per post and columns for platform, date, format, reach, engagement rate, deal ID, fee, and payout status. Use a second tab for the deal pipeline and a third tab for a weekly rollup. Enter data on the same day each week, never mix platform-reported and estimated figures in the same column, and store the engagement rate formula alongside every rate figure. The graduation threshold covered earlier, manual entry costing more hours than the tool costs money, is the signal to move.
What Apps Do UGC Creators Use?
Most solo UGC creators run their business across TikTok Creator Analytics, Instagram Insights, YouTube Studio, a spreadsheet for deal tracking, and a separate invoicing or payment tool. None of these surfaces share a data model, so consolidation stays manual. Platforms like Sozee consolidate scheduling, analytics, and content production in one place, which removes the export-and-paste cycle that consumes hours each week as deal volume grows.
How Do I Get To Creator Analytics On TikTok?
Open the TikTok app, tap your profile icon, then tap the menu icon (three lines) in the top right. Select Creator Tools, then Analytics. You will see an Overview tab with video views, profile views, likes, comments, shares, and followers. The Content tab shows per-video performance including views, average watch time, and traffic source. The Followers tab shows follower growth, top territories, and follower activity, and a LIVE tab appears if you use TikTok Live. Analytics is only available on Business Accounts, so if you do not see it, switch your account type under Settings and Privacy → Account → Switch to Business Account. The in-app surface shows more data than the TikTok Display API returns programmatically, and per-video retention plus audience demographics visible in-app are not available through the public API for accounts you do not own.
Can ChatGPT Build a Creator Analytics Dashboard?
ChatGPT can draft a spreadsheet schema, define column headers, write formulas, and generate a data model for a UGC creator analytics dashboard. It cannot authenticate to TikTok, Instagram, or YouTube APIs, pull live data, refresh metrics on a schedule, or maintain the integration when a platform deprecates an endpoint. The real constraint is live data access and ongoing maintenance. A schema ChatGPT produces in five minutes is a useful starting point, and keeping it current as platform APIs change requires either manual entry or a dedicated tool.
Conclusion: The Dashboard You Control
This article has covered two starting points, a spreadsheet for solo creators and a dedicated tool once manual entry outgrows it. There is a third option in between. Platform-native analytics such as TikTok Creator Analytics, Instagram Insights, and YouTube Studio are the right primary source for any creator who needs depth on a single platform and is not yet consolidating across channels.
The spreadsheet is the correct starting point for a solo creator with fewer than 10 active deals on one or two platforms. Platform-native analytics deepen understanding of each channel. A dedicated UGC analytics dashboard becomes the right answer when manual entry costs more hours than the tool costs money, or when the question “which creator should we re-book?” cannot be answered from one view.
As platform APIs shift, and they will, the dashboard that survives is the one whose data model you control. Build the model first. Know what each platform will and will not hand over. Then choose the tool that closes the loop from production to publication to measurement without forcing exports into five other apps to run your business.
Build your creator analytics dashboard on Sozee.