Key Takeaways
- Brand-aligned AI image automation cuts costs from $500 per manual image to under $1, with 90% fewer revisions and 30x faster production.
- Use the hard ROI formula: (Manual Cost – AI Cost) / AI Cost x 100. Many teams see 300% revenue growth by scaling content volume 10x.
- Track KPIs such as 2x CTR lifts, 150% revenue per image growth, and 95%+ likeness consistency compared with variable manual results.
- A three-tier ROI framework tracks investment, efficiency, and performance. Agencies often reach 80% cost savings and 150% revenue growth in 90 days.
- Measure brand visibility with AI scores (0-100) and A/B testing. Start with Sozee today to calculate your ROI potential.
Why ROI Matters for Brand-Aligned AI Image Automation
Brand-aligned AI images directly drive revenue across OnlyFans PPVs, TikTok teasers, and Instagram campaigns. Unlike generic AI visuals, brand-aligned automation keeps likeness and visual identity consistent across thousands of assets. 74% of campaigns now use AI-generated video or image content, so ROI tracking has become a core competitive requirement.
Clear baselines against manual production, such as $500 per image and a 2-week turnaround, create a starting point for measuring efficiency and revenue gains. Start creating now with Sozee’s brand-aligned AI automation.
3-Tier ROI Framework for AI Image Automation
Agency leaders managing multiple creators benefit from a structured ROI framework for AI content automation. This three-tier model covers investment costs, efficiency gains, and performance improvements.
Tier 1: Calculate Your Total AI Image Investment
Begin by mapping every cost that contributes to your AI image automation investment:
| Cost Category | Manual Method | AI/Sozee | Savings |
|---|---|---|---|
| Monthly Subscription | $0 | Not publicly disclosed – visit sozee.ai for pricing | – |
| Time Investment | 4 hours @ $50/hr | 5 minutes @ $50/hr | $196 |
| Revision Cycles | 3-5 rounds | 90% reduction | $150 |
| Total per Image | $500 | Significantly reduced | Substantial savings |
Use this formula to calculate cost per AI brand image asset: Cost per AI Brand Image = (Subscription + Time@$50/hr) / Images Generated. Time to market drops from weeks to minutes, which supports rapid content launches and frequent testing.
Tier 2: Measure Hard ROI from Efficiency and Volume
Hard ROI focuses on measurable efficiency gains and volume increases from AI automation:
| KPI | Manual Baseline | AI Performance | Improvement |
|---|---|---|---|
| Content Utilization | 10% | 100% | 10x increase |
| Production Timeline | 1 month | 1 afternoon | 30x faster |
| Cost per AI Brand Image Asset | $200 | $0.50 | 400x reduction |
| Monthly Output | 20 images | 200+ images | 10x volume |
Calculate hard ROI with this formula: Hard ROI = (Manual Cost – AI Cost) / AI Cost x 100. Producing 100 images per month with AI instead of manual methods often delivers 300% revenue growth from volume scaling alone.
Tier 3: Track Engagement and Revenue Performance ROI
Soft and performance ROI capture engagement gains and revenue lifts from brand-aligned AI images. AI image engagement data shows strong results. Iconic London achieved a 126% conversion rate lift and 11% average order value lift with AI-generated brand-aligned content.
Core brand-aligned AI image metrics include 95%+ likeness consistency scores and 2x click-through rates compared with generic content. To measure brand visibility in AI-generated content, track consistency scores through A/B tests, which often show 25% conversion lifts for aligned imagery.
Performance gains frequently include 40% PPV revenue increases and stronger retention from consistent brand presentation across every touchpoint.
KPIs That Prove ROI for Brand-Aligned AI Content
These KPIs give a complete view of ROI for brand-aligned AI content:
| KPI | Manual Benchmark | AI Benchmark | Target Lift |
|---|---|---|---|
| Revision Rate | 60% | 6% | 90% reduction |
| Engagement Lift | Baseline | 2x CTR | 100% increase |
| Revenue per Image | $50 | $125 | 150% increase |
| Likeness Score | Variable | 95%+ | Consistency |
56% of marketers prioritize AI-powered automation for workflow efficiency. Successful teams often see 5x faster production and 2.5x revenue improvements.
How to Track Brand Visibility in AI-Generated Content
Brand visibility tracking relies on specific metrics that confirm consistent representation across AI-generated assets. AI Visibility scores range from 0-100 and benchmark how often your brand appears correctly in generated content compared with competitors.
Key metrics include citation share, sentiment around brand mentions, and consistency scores across content variations. 86% of AI-cited sources are brand-managed, which highlights how crucial it is to control brand representation in AI outputs.
Sozee Case Study: 90-Day ROI from Brand-Aligned AI Images
Agency X used Sozee’s brand-aligned AI image automation and reached measurable ROI within 90 days. The agency cut per-image costs by 80%, increased content output 10x, and grew revenue 150% through more frequent and consistent posting.
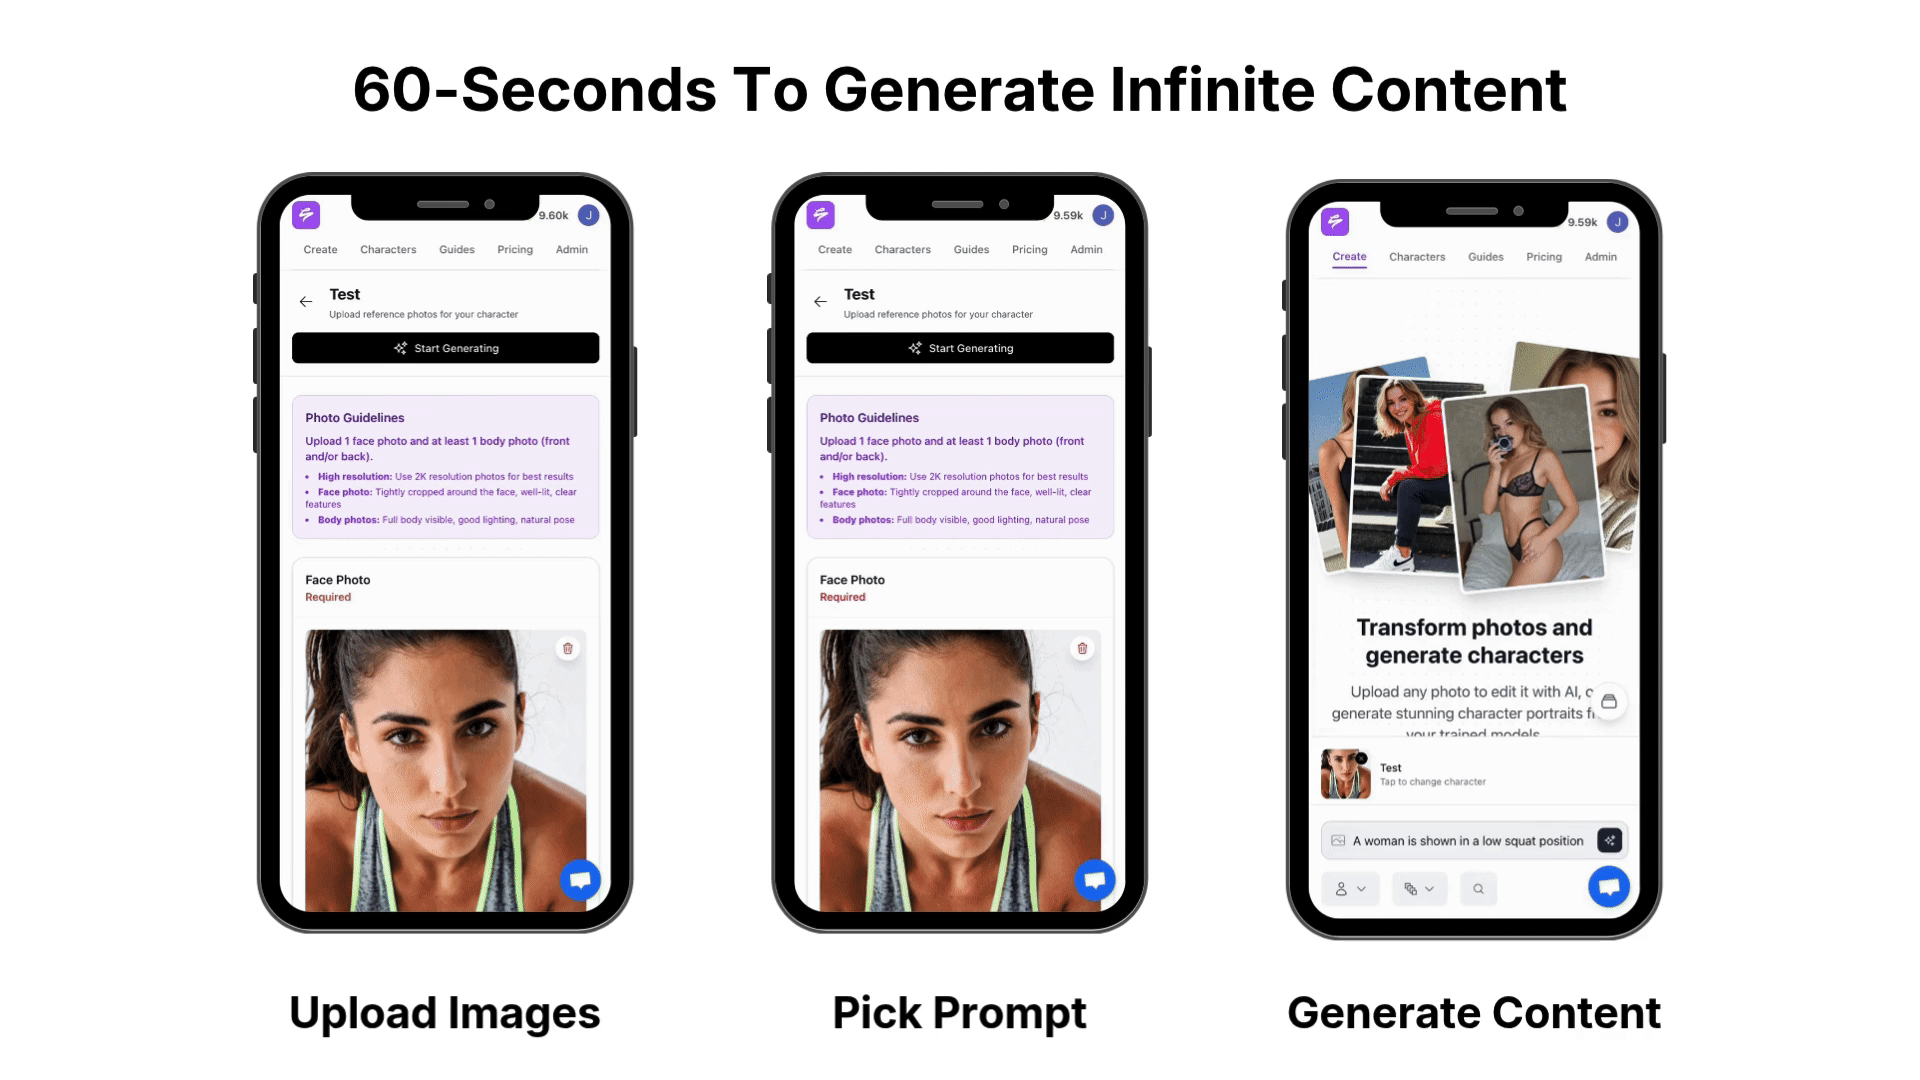
The workflow stayed simple. The team uploaded creator photos, generated brand-aligned content sets, then exported directly to monetization platforms. This streamlined flow removed almost all revision cycles and preserved near-perfect likeness across thousands of assets.
Revenue growth came from a 40% lift in PPV sales, 2x higher engagement rates, and broader content variety without extra shoot costs. The agency scaled from 20 images per month to more than 200 while dropping per-image costs from $200 to under $1.
Calculate your ROI potential with Sozee’s brand-aligned AI automation.
Common Pitfalls and Practical Pro Tips
Teams often struggle with weak brand alignment, which lowers engagement, and inconsistent likeness, which erodes audience trust. Strong implementations keep brand consistency front and center through clear prompts and ongoing A/B testing of content variations.
Helpful pro tips include setting 30-day and 90-day tracking windows for ROI, using reusable style bundles to repeat winning formats, and adding approval workflows for agency-managed creators to protect quality.
Conclusion: Turn AI Images into Measurable ROI
Measuring ROI for brand-aligned AI image automation works best with structured tracking of investment, efficiency, and performance. This three-tier framework gives you a repeatable way to prove value and scale content operations. Set your baselines now and get started with Sozee for measurable brand-aligned AI image ROI.
FAQ
How do you calculate ROI for AI image automation?
Calculate ROI with the formula (Revenue Lift – AI Costs) / AI Costs x 100. Include subscription fees, time spent, and infrastructure costs in your AI total. Measure revenue lift from higher content volume, stronger engagement, and better conversion rates. Track both hard ROI from efficiency and soft ROI from brand consistency.
What are the key KPIs for brand-aligned AI content?
Key KPIs include revision rate reduction, with a 90% decrease as a strong target, and engagement lift, with 2x CTR as a common goal. Revenue per image often rises 150%, and likeness consistency should reach at least 95%. Also monitor production speed, cost per AI brand image asset, content utilization, and monthly output volume.
How do you measure brand visibility in AI-generated content?
Measure brand visibility with AI Visibility scores on a 0-100 scale, citation share percentages, sentiment around brand mentions, and consistency scores across variations. Track competitive position, topic relevance, and brand authority signals. Use A/B tests to compare brand-aligned and generic AI content for conversion rate gains.
What ROI can creators expect from AI content automation?
Creators often reach 300-500% ROI within 90 days. Results come from 80% cost savings per image, 10x content volume growth, and 150% revenue increases from more frequent posting. PPV sales frequently rise about 40% because audiences see consistent, on-brand imagery and more regular content drops.
What does cost per AI brand image asset include?
Cost per AI brand image asset includes platform subscription fees, time spent generating and reviewing content, infrastructure costs, and any revision work. Typical AI costs range from $0.50 to $4.50 per image, compared with $200 to $500 for manual production. This gap creates up to 400x cost reduction potential at scale.