
Key Takeaways
- AI content generation cuts creation time by about 65%, scaling output from roughly 5 photos per day to 50+ with the right tools.
- Track 7 core KPIs: content velocity, cost per asset, quality scores, revision rates, engagement lift, ROI, and scalability index.
- Set manual baselines first, using clear formulas like Assets ÷ Time for velocity and (Revenue – Investment) ÷ Investment for ROI.
- Quality metrics such as LPIPS scores and fan pass-rates help keep AI content at about 95% consistency with strong engagement.
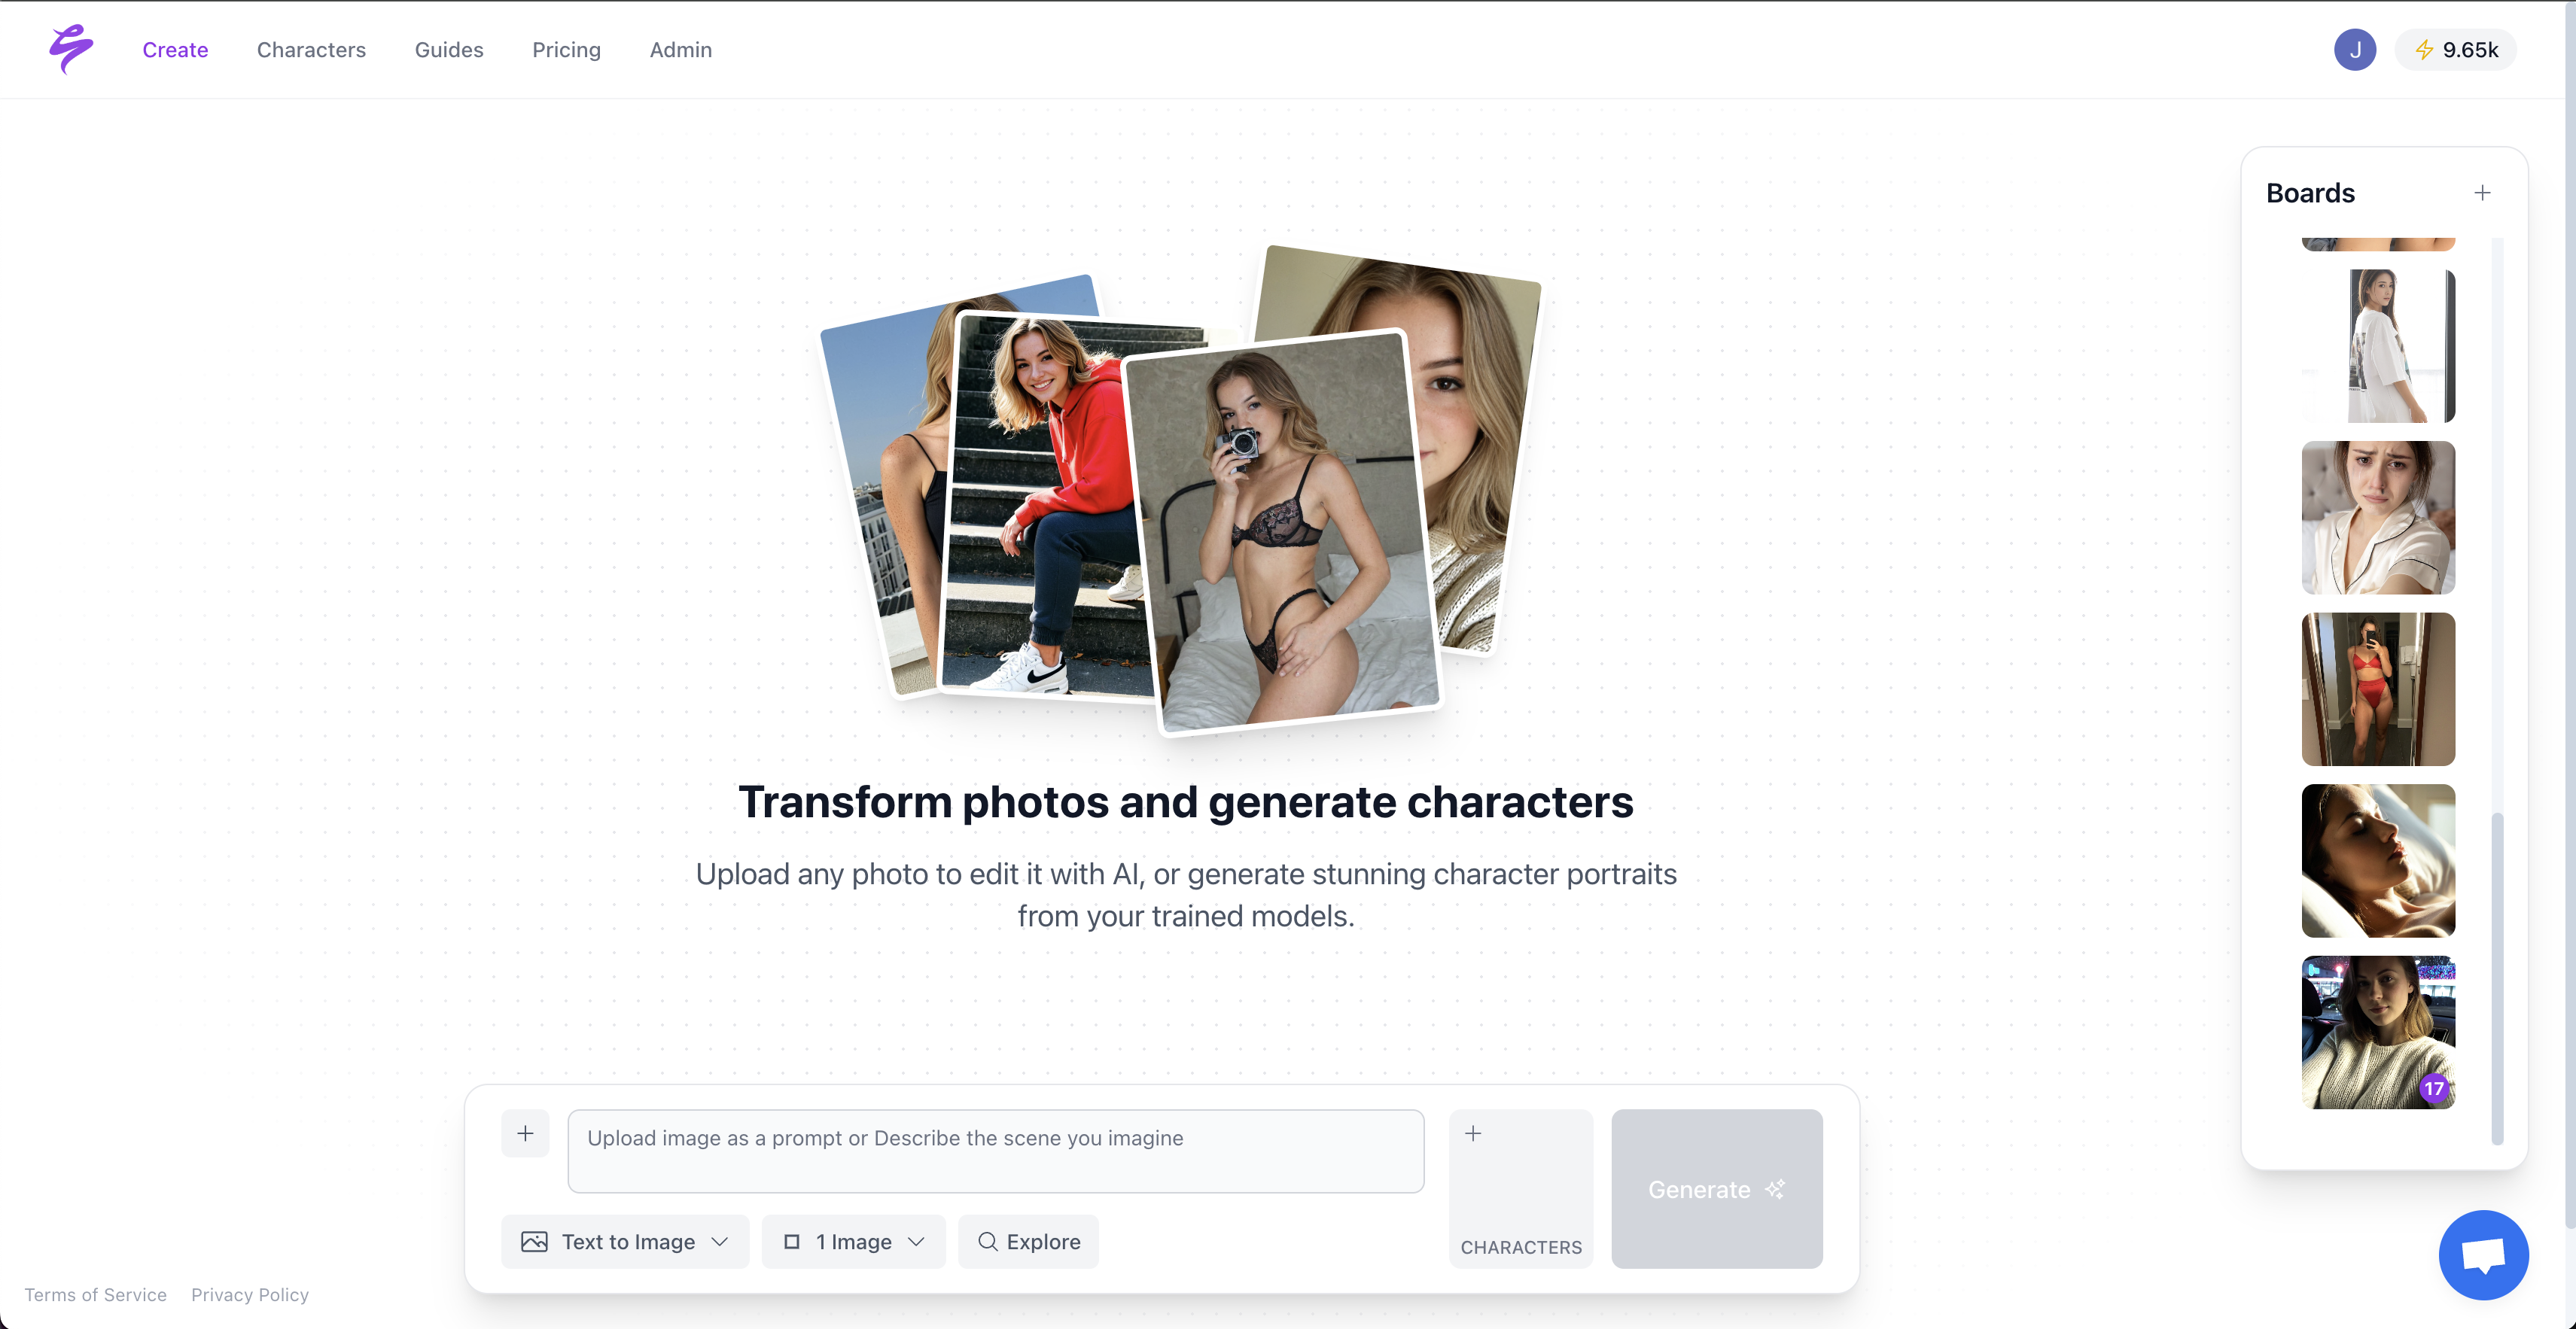
- Tools like Sozee help creators produce a month of content in an afternoon while delivering measurable speed, cost savings, and realistic visuals.
7 Key KPIs to Measure AI Content Generation Efficiency
The table below shows how each KPI shifts from manual to AI workflows and highlights the efficiency gains you can expect when you track the right metrics.
| KPI | Formula/Baseline | Manual vs AI Benchmark | Sozee Example |
|---|---|---|---|
| Content Velocity | Assets per Hour | 5 photos/day → 50+ photos/day | Instant generation from 3-photo upload |
| Cost per Asset | Total Cost ÷ Assets Produced | $50/photo → $5/photo | Zero production cost vs shoots |
| Quality Score | LPIPS + Fan Pass Rate | 70% manual → 95% AI consistency | Hyper-realistic likeness accuracy |
| Revision Rate | Edits ÷ Total Assets | 60% manual edits → 18% AI edits | AI-assisted correction tools |
1. Content Velocity (Time to Output)
Content velocity tracks how many assets you produce in a set period and anchors every other efficiency metric. As noted in the key findings above, AI tools deliver about a 65% time reduction by compressing 3–8 hour manual workflows into minutes per asset.
Use this formula: Assets Produced ÷ Time Invested = Velocity Rate. Manual baselines often show 3–8 hours per quality photo when you include setup, shooting, and basic editing. AI tools cut this to minutes per asset, although you still spend time on prompts and quality checks.
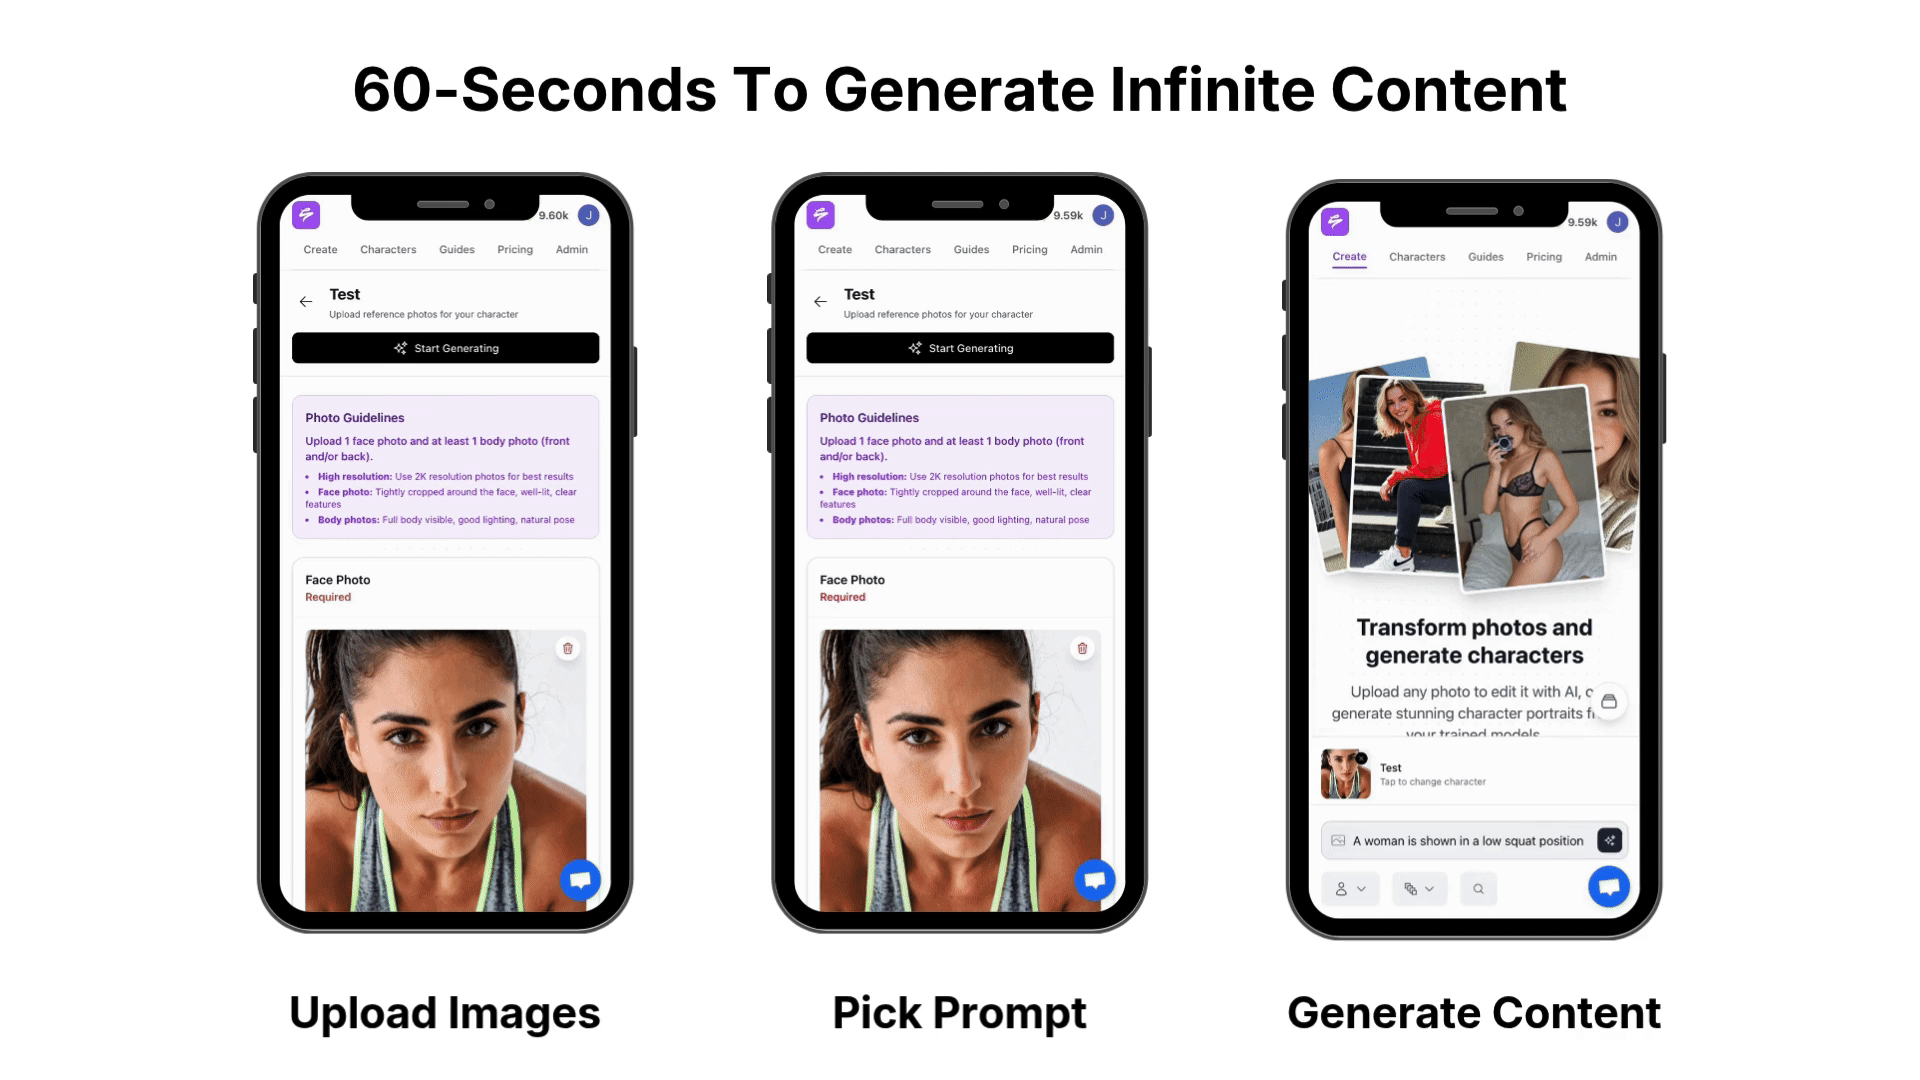
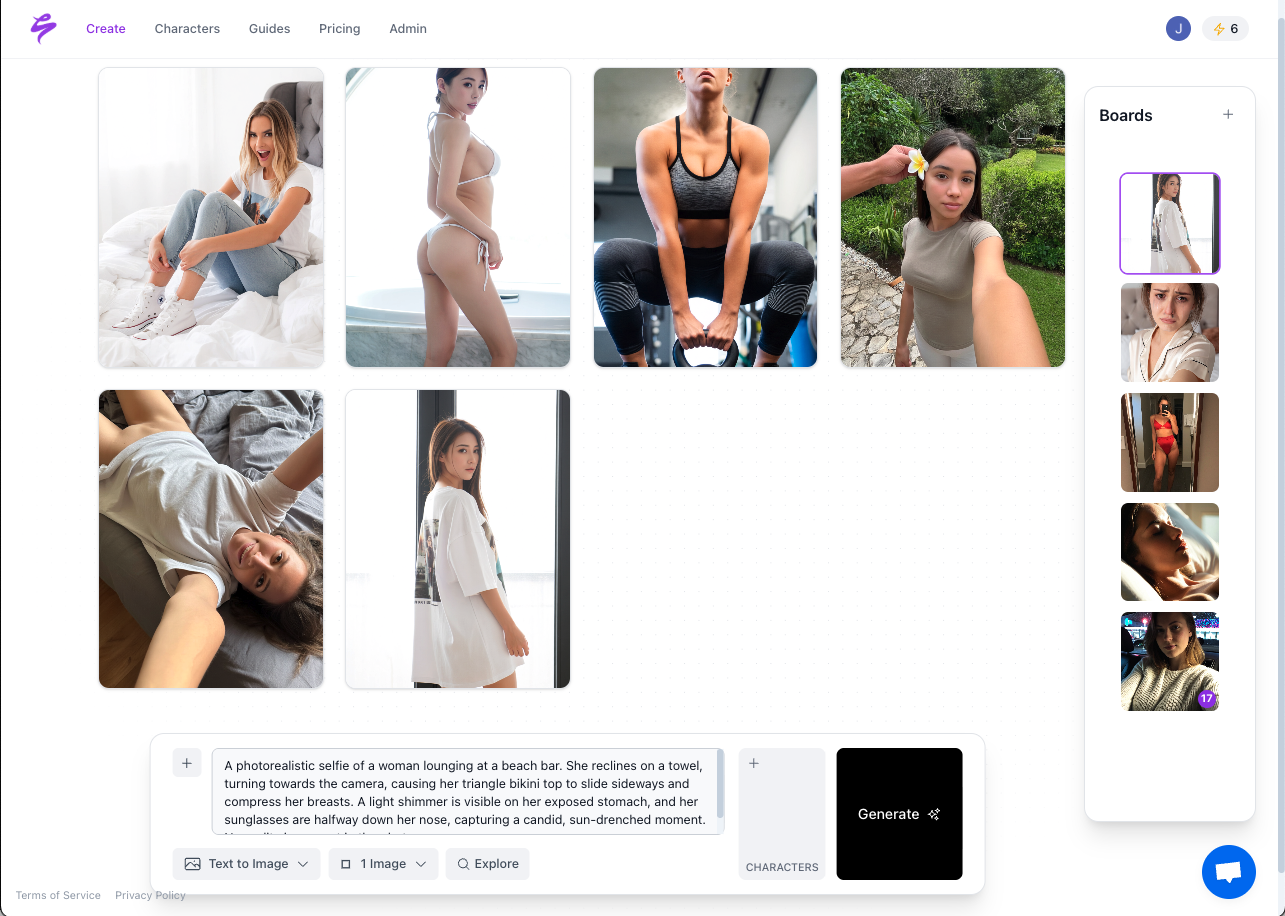
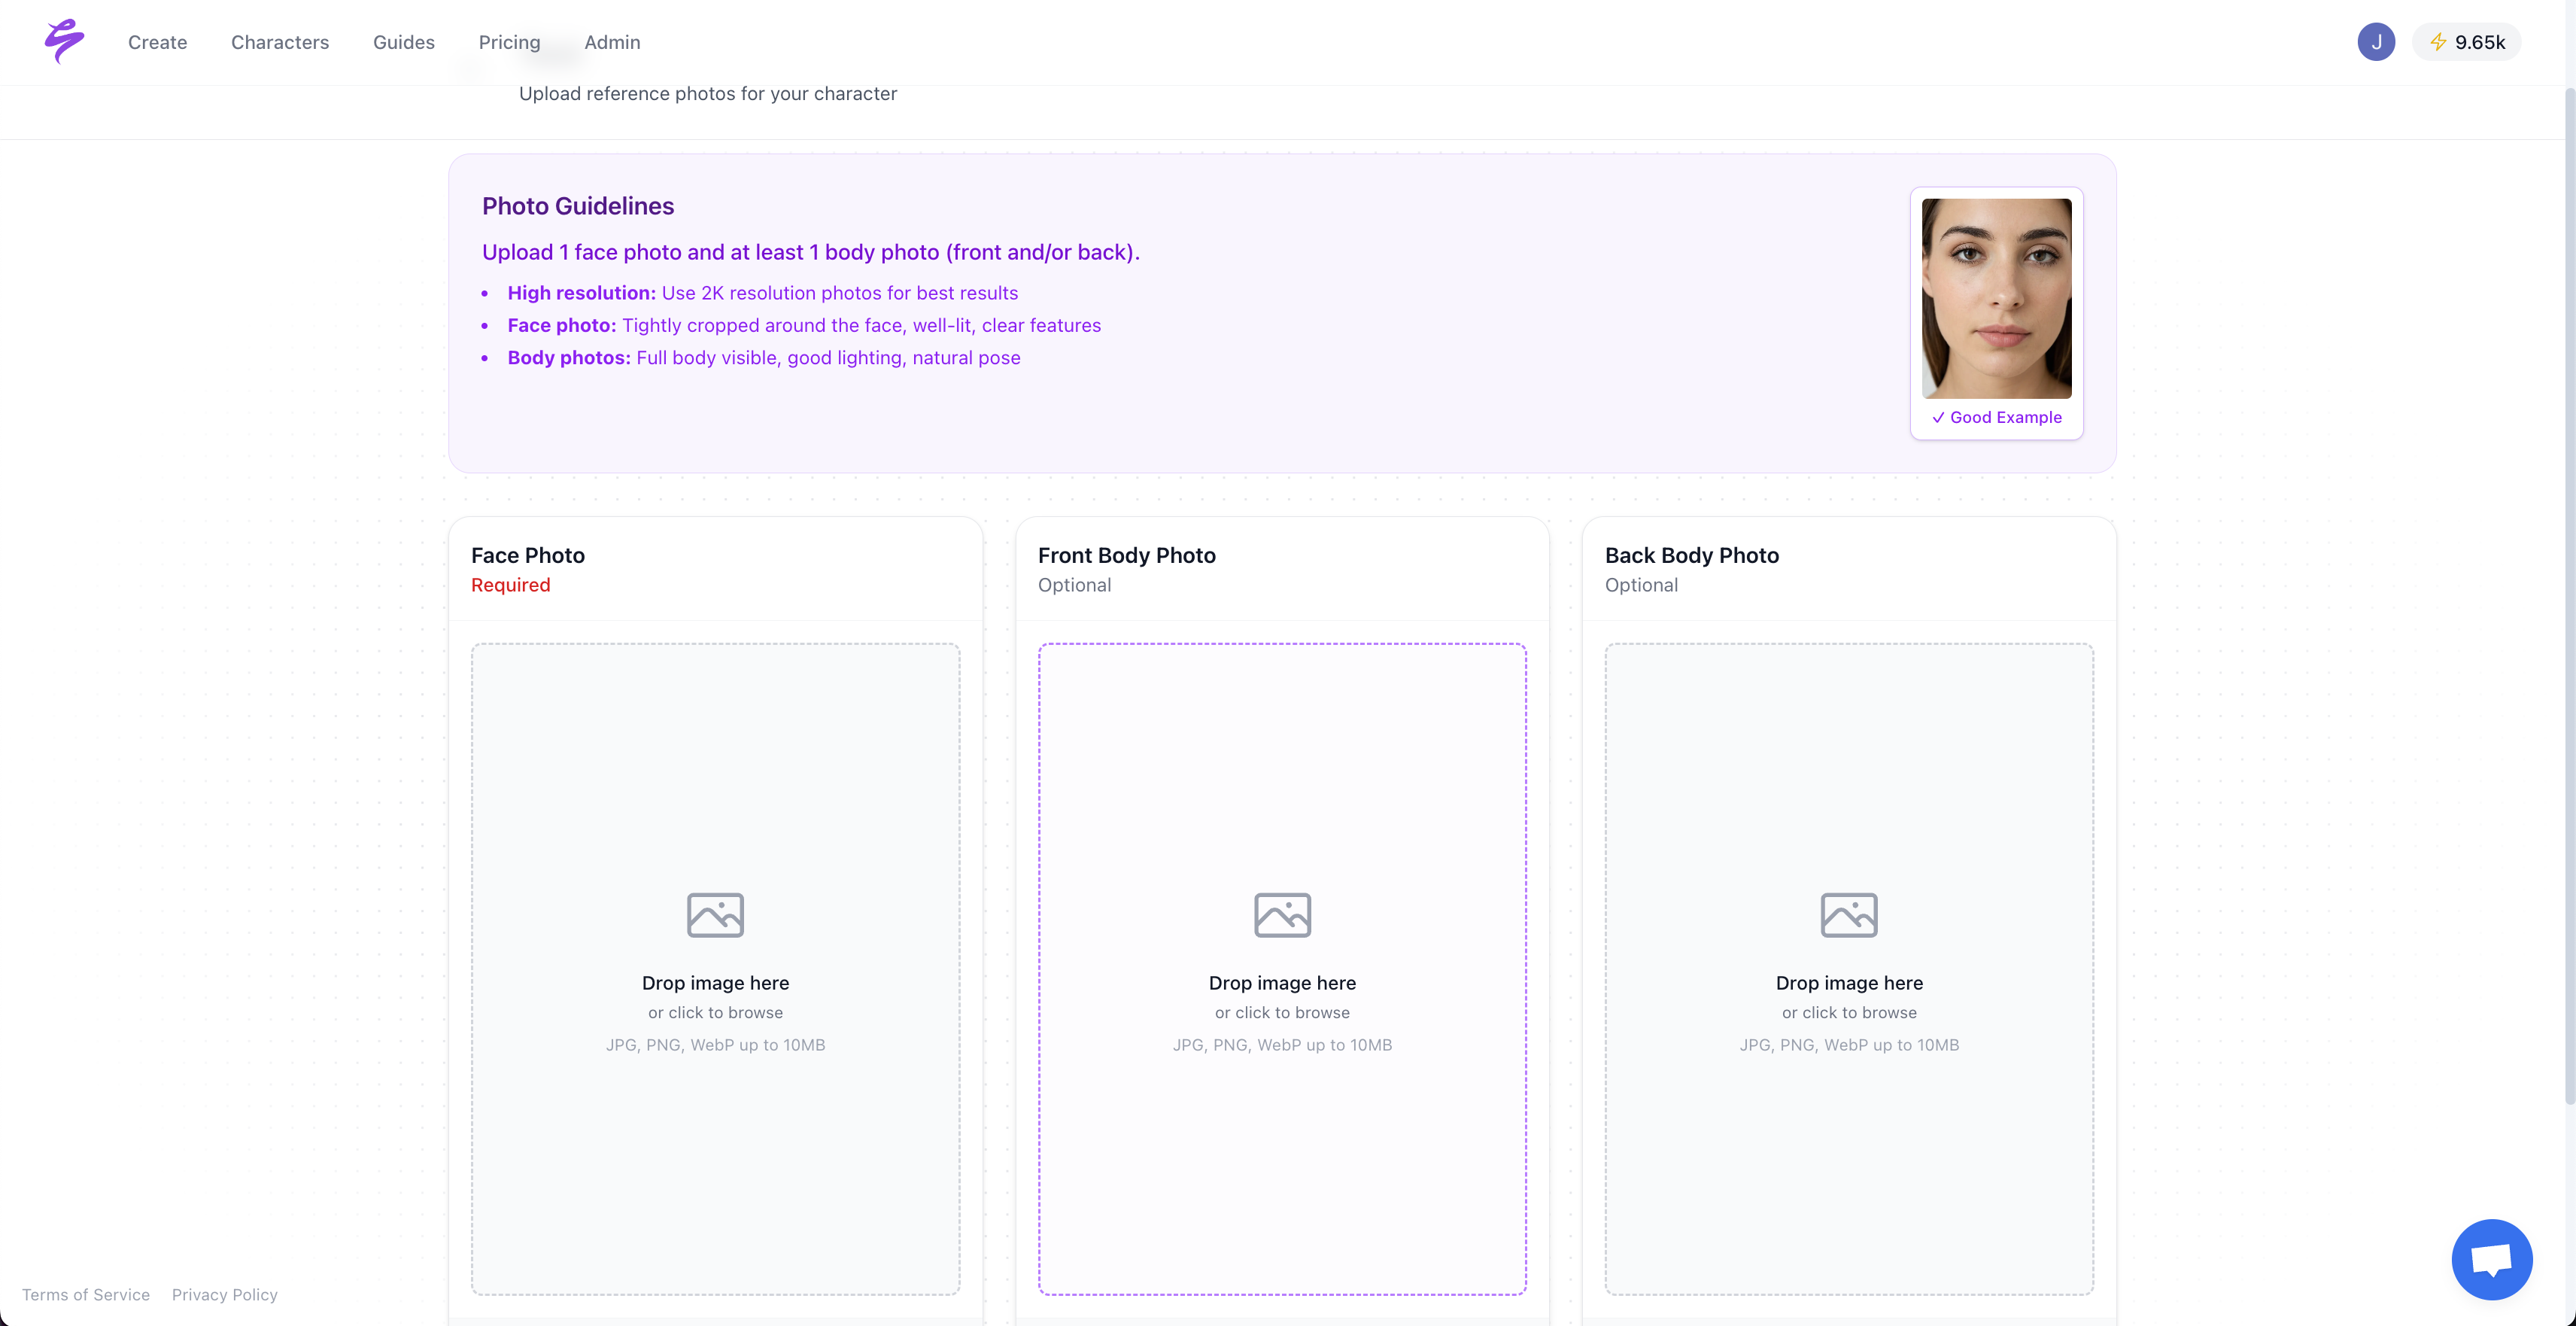
Sozee removes training time entirely. You upload 3 photos and can immediately generate unlimited content. Hyper-realistic output keeps post-processing low, so the velocity gains hold across your full production pipeline.
2. Cost per Asset
Cost per asset shows the real economics of AI content by including every expense from tools to labor. Traditional shoots often land between $50 and $200 per final asset once you add photographer fees, locations, wardrobe, and editing.
Use this formula: (Tool Costs + Labor Hours × Hourly Rate + Overhead) ÷ Assets Produced. AI sharply reduces variable costs because you avoid location fees, cut labor hours, and reuse a single subscription across many assets. You still spread initial setup and learning time across your total output.
Sozee improves this equation by removing training requirements and production costs such as travel and shoots. Because instant likeness recreation needs no upfront model training or complex setup, every new asset contributes directly to positive ROI instead of paying down a large initial investment.
3. Quality/Realism Score
Quality metrics confirm that AI content still drives engagement and revenue. LPIPS and VMAF provide objective quality measurements that align with human perception, while fan engagement data validates results in the real world.
Combine technical metrics with audience behavior. LPIPS scores below 0.1 signal high perceptual similarity. Track click-through rates, engagement duration, and conversion rates to see how fans respond. Manual content often hits about 70% consistency because of lighting and setup changes, while well-tuned AI workflows can reach 95% or higher.
Sozee focuses on hyper-realistic output so AI content looks like professional shoots. This realism supports creator monetization by protecting fan trust and keeping engagement rates strong.
4. Revision/Verification Rate (Trust Tax)
The revision rate captures the “trust tax,” which is the extra editing needed before AI content goes live. High revision rates signal weak tool choices or clumsy workflows that erase your speed gains and inflate hidden costs.
Use this formula: Assets Requiring Edits ÷ Total Assets Generated × 100. Manual workflows often see about 60% of assets needing fixes for lighting, composition, or technical issues. AI tools can push this higher at first while you learn to spot and correct common generation errors.
Sozee lowers revision rates with accurate likeness recreation and AI-assisted correction tools for skin tone, hands, lighting, and angles. This creator-focused design reduces artifacts such as plastic-looking skin or warped facial features that usually demand long edit cycles.
See how Sozee's AI-assisted correction tools reduce your revision rate to under 20%
5. Engagement Lift
Engagement lift shows whether AI content keeps or improves audience response compared with manual work. AI-optimized content can reach 34% higher click-through rates when tuned well, while low-quality AI can cut engagement by up to 40%.
Track views per post, the ratio of likes to comments, story completion rates, and pay-per-view conversions. Strong AI adoption should keep at least 90% of your manual engagement while you post more often and test more creative variations.
Sozee’s realistic visuals help creators match or beat manual engagement while posting up to five times more often. This combination of quality and frequency supports steady revenue growth instead of short-lived spikes.
6. ROI (Revenue per Asset)
ROI shows the direct financial impact of AI content on your business. Organizations report an average 340% ROI within 18 months of AI implementation, the same timeframe often used for engagement optimization, while content marketing specifically reaches about 410% average ROI.
Use this formula: (Revenue Generated – Total Investment) ÷ Total Investment × 100. Track revenue per post, subscriber growth, and pay-per-view sales to set a clear baseline. Effective AI tools raise revenue by supporting more frequent posting while cutting production costs.
Sozee helps creators reach strong ROI by combining sharp cost reductions with major velocity gains, such as producing a month of content in a single afternoon. Because the platform focuses on monetizable content, these gains show up in revenue, not just vanity metrics.
7. Scalability Index
The scalability index reflects how far you can grow output without matching increases in time or burnout. High-performing organizations redesign workflows with AI for durable efficiency gains instead of short bursts of productivity.
Use this formula: Output Capacity ÷ Time Investment × Sustainability Factor. The sustainability factor includes creator satisfaction, long-term content quality, and audience retention. True scalability means you can expand content volume without degrading quality or exhausting yourself.
Sozee supports this kind of scalability by separating content production from creator availability. You upload photos once, then generate many variations while keeping quality steady, even as posting frequency climbs.
Common Pitfalls and Baselines for Creators
Understanding these seven KPIs only solves half the problem, because you also need accurate measurement habits. Many creators misjudge AI efficiency by ignoring hidden costs and skipping baseline tracking, which leads to bad comparisons and tool choices.
Creators often underestimate prompt refinement time, quality checks, and the learning curve built into new tools. Establish baselines before you add AI by tracking current content velocity, cost per asset, and engagement rates for at least 30 days. These numbers give you a clear reference point for future gains.
Quality verification stays essential, even when AI speeds up production. AI content that fails audience scrutiny harms credibility more than slower manual work. Prioritize tools and workflows that deliver consistent, reliable results and keep your quality bar steady as you scale.
Build Your AI Efficiency Dashboard
Once you know what to measure and which mistakes to avoid, you can build a simple dashboard that turns raw data into clear insights. Start with tracking spreadsheets that use formulas such as Velocity = Assets ÷ Time, Cost Efficiency = Manual Cost ÷ AI Cost, and ROI = (Revenue – Investment) ÷ Investment.
Rather than building every formula from scratch, dashboard templates with pre-built KPI widgets speed up setup and keep measurement consistent across teams. These templates usually include the core formulas already, which reduces manual configuration and errors.
Sozee’s workflow fits neatly into these tracking systems. You upload photos, generate content, export to scheduling tools, and then feed performance data back into your dashboard. Consistent output quality simplifies analysis because you spend less time explaining outliers and more time acting on trends.
Scale Infinitely with These 7 KPIs
These seven KPIs turn AI content generation from a one-off experiment into a repeatable business system. Agencies gain more predictable revenue, and creators free up time for strategy, brand building, and community work. Clear measurement also exposes which tools deliver real efficiency instead of marketing hype.
Sozee focuses on creator-first AI content generation with measurable gains in speed, cost, and quality consistency. The platform’s realistic output and monetization focus help ensure KPI improvements translate into actual business growth. Start tracking these 7 KPIs with Sozee's measurement-ready workflow
FAQ
How do you measure AI efficiency in content creation?
Measure AI efficiency with seven KPIs: content velocity, cost per asset, quality or realism scores, revision rates, engagement lift, ROI, and scalability index. Set manual baselines first, then track changes across these metrics with dashboards that use automated formulas. Aim for sustainable gains instead of short-lived speed spikes.
What are the best KPIs for GenAI content performance?
The most useful GenAI KPIs blend productivity metrics, quality measures, and business impact. Track velocity as assets produced per unit of time, calculate cost per asset with all overhead included, and monitor engagement rates. Combine these with ROI and scalability to confirm that AI content supports long-term monetization.
How do you measure AI content realism and quality?
Measure AI realism with technical metrics such as LPIPS scores, where values below 0.1 show high perceptual similarity. Pair these with audience data like engagement rates, completion rates, and conversions. Fan pass-rate acts as the final test, because quality standards are met when audiences cannot reliably tell AI from manual content.
What benchmarks exist for AI content generation productivity?
Current benchmarks show about a 65% reduction in content creation time, 340–494% ROI within 18 months, and roughly 34% higher click-through rates for well-optimized AI content. Top performers often reach four times the previous velocity while maintaining around 95% quality consistency. Cost per asset usually drops by 80–90% compared with traditional production.
How do you calculate ROI for AI content generation tools?
Calculate AI content ROI with this formula: (Revenue Generated – Total Investment) ÷ Total Investment × 100. Include tool subscriptions, training time, and workflow optimization in the investment figure. Track revenue per post, subscriber growth, and pay-per-view sales to see the impact. Strong implementations often reach 340% or higher ROI through more frequent posting and lower production costs.